Chapter 10: Extracting Raster Statistics and Time Series
Summary
The Extract Grid Statistics function (red box in Figure 10‑1) calculates summary statistics for a polygon (or a set of polygons) from a shapefile, using a raster or set of rasters from the selected climate dataset. The tool allows to calculate (Average) the spatial average within each polygon, (Count) the number of pixels with a valid value within the polygon, (Maximum) the maximum value within each polygon, and so on with each of the other parameters. For example, we can calculate the spatial average of precipitation for each district for each month from 1981 to the present. This produces a CSV table that could be analyzed using Excel.

Figure 10-1 The Extract Grid Statistics tool calculates summary statistics for a polygon (or a set of polygons) from a shapefile, using a raster or set of rasters fields.
10.1. Extract statistics
To extract summary statistics for a set of polygons, follow the steps below:
Open the Extract Statistics from Raster Data Using Shapefile tool from the GeoCLIM toolbar.
Select a shapefile containing the polygons of interest (e.g., districts) and select a unique ID field (a data field in the shapefile that will uniquely identify each polygon, such as district names) Figure 10‑2 (1).
Select the type of summary for the pixels within the polygon, see the Summary˅ pulldown menu, Figure 10‑2 (2).
Select the raster file(s). Figure 10‑2 (3): Click on the Add button and browse to the directory where the raster files are located.
Select the files to be used in the process.
Click Open.
Back on the Extract Grid Statistics window, specify the output directory if necessary.
Click OK.
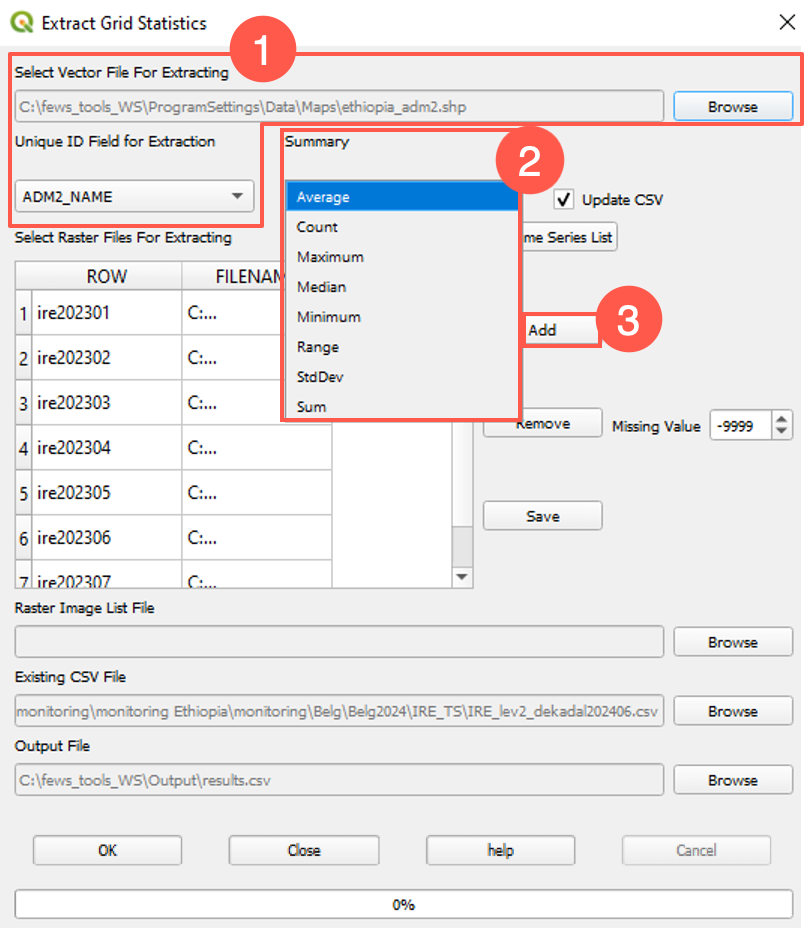
Figure 10-2 The Extract Statistics tool calculates the spatial statistics for each raster data set, using polygons of the selected shapefile. The output is a table containing a row for each polygon and a single column value (statistics selected) for each raster.
10.2. Results
The Extract Grid Statistics tool produces a CSV table file with rows corresponding to the polygons from the input shapefile. Columns contain the summary value for each raster file selected. Figure 10‑3 shows the output CSV table in Excel for the spatially averaged rainfall using CHIRPS dekads for each of the countries in the EAC region. To do additional analysis of the results, such as the production of time series plots, open the CSV file in Microsoft Excel (or another spreadsheet program).
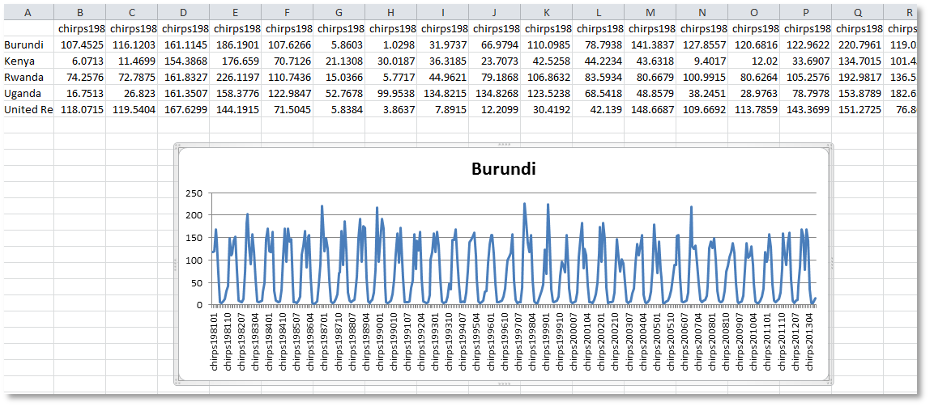
Figure 10-3 The resulting table has a row for every polygon and every column represents the summary value for each raster.
This tool facilitates updating the time series of a group of polygons for the purpose of monitoring the rainy season. You can complete the time series using CHIRPS final, CHIRPS prelim, and the forecast for the next decade. For example, for each polygon in column A in Figure 10-3, the time series includes CHIRPS-final data from 1981 dek01 to 2024 dek03, CHIRPS-prelim dekads 04 and 05, and forecast dekad 06.

Figure 10-3 Historical-final CHIRPS (blue), prelim-CHIRPS (orange), and 10-days forecast (pink)