Chapter 8: Calculate Long-Term Changes in Averages
Summary

Figure 8-1 The Long-Term Changes in Averages tool facilitates the comparison of two periods to determine changes in rainfall patterns.
Another way to estimate changes in climate patterns is by comparing the averages between two periods within a time-series. The Long-Term Changes in Averages tool (red box in Figure 8‑1) allows you to estimate the trend by dividing the time-series into two groups of years and calculating the difference in average between the two groups (difference = group2-group1).
8.1. Calculating changes in averages
To run the tool, follow the steps below:
Open the Long-Term Changes in Averages tool from the main toolbar, see Figure 8‑1.
Select the season to be analyzed, see Figure 8‑2 (1).
In series 1, select the first period of time, see Figure 8‑2 (2).
In series 2, select the second period, see Figure 8‑2 (3).
Click Process to finish.
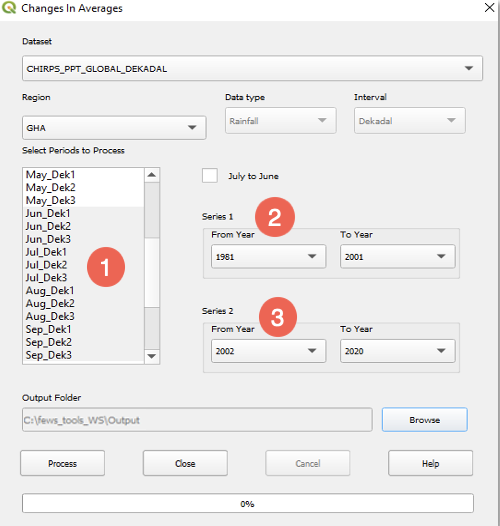
Figure 8-2 The Long-Term Changes in Averages tool allows you to identify changes in climate patterns by calculating the differences in averages between two periods of time in a time series.
Figure 8‑3 shows the output map result of the change in average from the 1981-2001 period (series 1) compared to the 2002-2020 period (series 2), for the June-September season. The result shows areas with increasing (green-blue) and decreasing (pink-red) mm of rainfall during the 2002-2020 period.
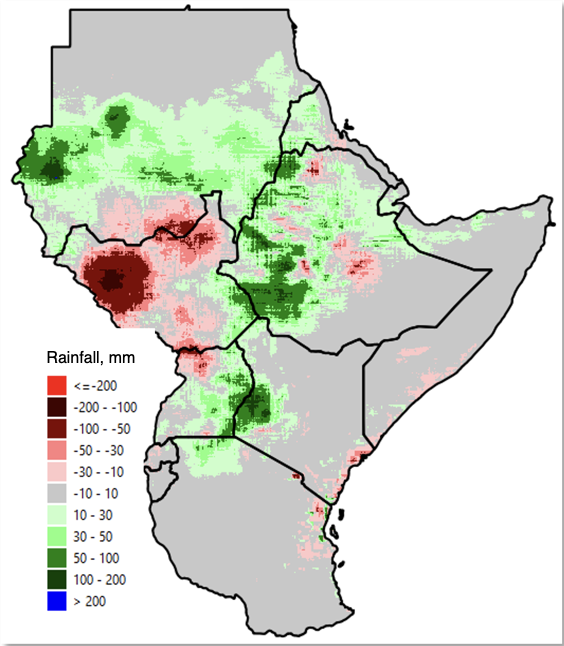
Figure 8-3 Difference in averages; green-blue colors show an increase in the latter period (series 2) while pink-red colors show a decrease in rainfall in that same period. The legend is given in mm per decade.