Chapter 11: GeoWRSI
Introduction
The GeoWRSI is a geospatial, stand-alone implementation of the Water Requirements Satisfaction Index (GeoWRSI), as implemented by the U.S. Geological Survey (USGS) for the Famine Early Warning Systems Network (FEWS NET) activity. The program runs a crop-specific water balance model for a user-selected crop in a user-specified region in the world, using raster data inputs. The program produces a range of outputs which can either be used qualitatively to help assess and monitor crop conditions during the crop growing season or regressed with yields to produce yield estimation models and yield estimates. In addition, the program has several tools for validation, enhancement and analysis of both input and output datasets. Other tools are available to post-process the water balance outputs so that they can be used for yield estimation.
Technically, the Water Requirements Satisfaction Index (WRSI) is the ratio of seasonal actual crop evapotranspiration (AETc) to the seasonal crop water requirement, which is the same as the potential crop evapotranspiration (PETc). Originally developed by the Food and Agriculture Organization (FAO), the WRSI has been adapted and extended by USGS in a geospatial application to support FEWS NET monitoring requirements. Yield reduction estimates based on WRSI contribute to food security preparedness and planning. As a monitoring tool, the crop performance indicator can be assessed at the end of every 10-day period during the growing season. As an early warning tool, end- of-season crop performance can be estimated using long-term average meteorological data.
11.1. Setting the GeoWRSI
To get started, there are three key settings you need to be familiar with. First, you'll set up the region for your analysis. Second, you'll configure the outputs to save. Finally, you'll set the WRSI parameters. Although there is an additional setting for crop parameters, we won't need to adjust that one frequently. Let's begin by focusing on these initial three settings.
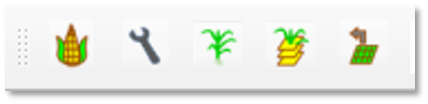
Figure 11-1 The GeoWRSI toolbar includes icons (left to right) for crop settings, water balance settings, running the WRSI, climatological WRSI/SOS analysis and output settings.
11.1.1. Regions
The FEWS Tools plugin allows you to set a region to work only with climate data using the GeoCLIM functions. Or add parameter to run the water balance. Once you select GeoWRSI Region (see red box on Figure 11-2), a new form opens up with the parameter to run the WRSI at 10 or 5 days time steps, (see blue box on Figure 11-2). The tool comes with a set of predefined regions for different areas in Africa and Central America.
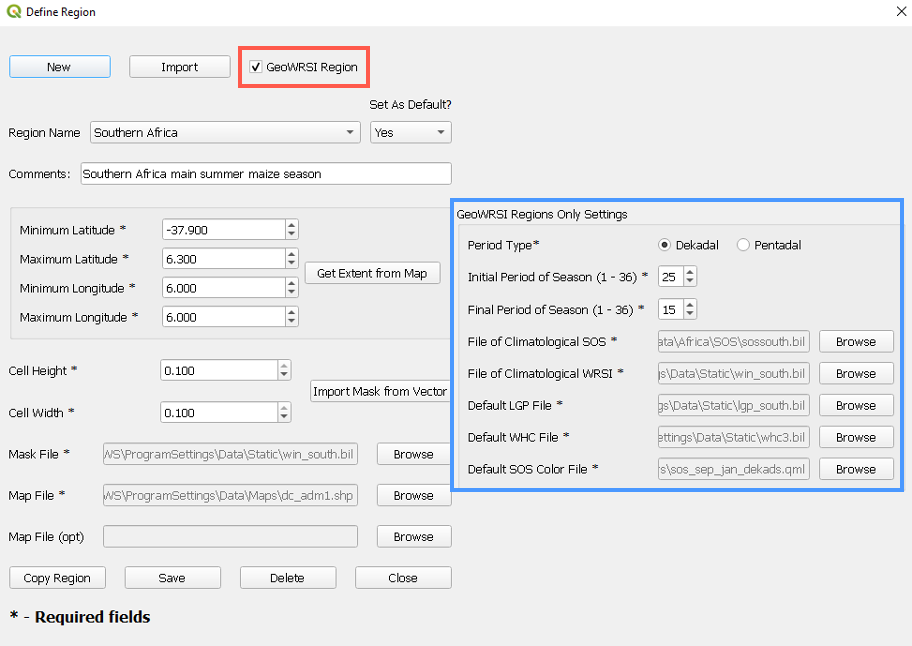
Figure 11-2 FEWS tools allows you to use the Region setting form for both the GeoCLIM and GeoWRSI.
11.1.2. Output settings
Specify the outputs that you want to save from the WRSI run by selecting the relevant outputs from the GeoWRSI output options dialog box (Fig 11-3). You can select outputs to save at the (1) Current/Forecast PEriod, (2) End of season/extended period and (3), every period (ie, dekad or pentad). Only 3 outputs can be saved at every period, namely WRSI, phenology, and soil water index.
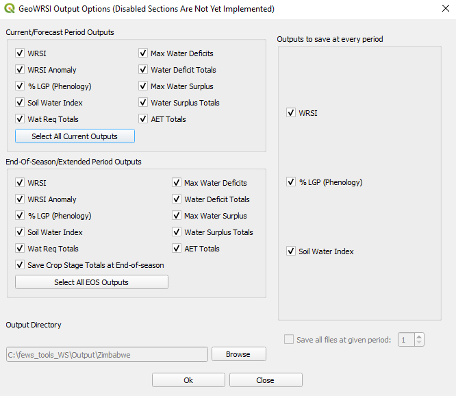
Figure 11-3 The GeoWRSI allows you to save all or a subset of outputs.
11.1.3. Setting the water balance parameters
A number of different water balance parameters can be specified for the WRSI run, including the region to run, the crop type, the start of season definition, the length of growing period (LGP) definition, the water holding capacity (WHC) definition, the mask definition, and the datasets to drive the model run. These settings are accessed from the WRSI Settings tool (Figure 11-4).
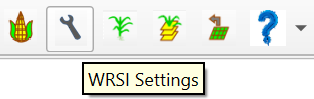
Figure 11-4 The WRSI settings allows you to define the Region, the crop type, Start of Season, Length of Season, Water Holding Capacity among other parameters to run the WRSI.
This opens up a dialog box where the different model parameters can be set (Figure 11-5). While several different parameters can be set as defined above, the most common parameters to set are the crop type and the region.
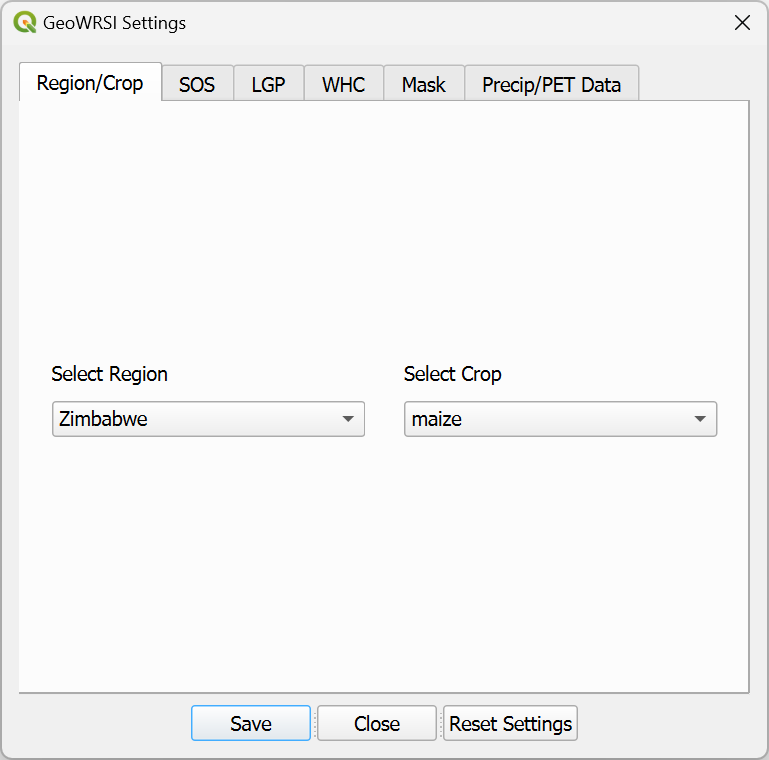
Figure 11-5 Select first the region and crop type.
Selecting the SOS, LGP, WHC, Mask and Precp/PET Data tabs allows these additional parameters to be changed as well (Figure 11-6). Unless you have a specific reason for changing these additional settings (e.g. to use a known planting that is different from the onset of rains), it is common practice to leave the additional settings unchanged. If you have changed the settings in the past for a special model run (e.g. to determine the potential impacts of planting for crops in different specific dekads of the same season), it is important to go through the different settings and ensure that they are all reset to the default setting, or that they are on the required setting.
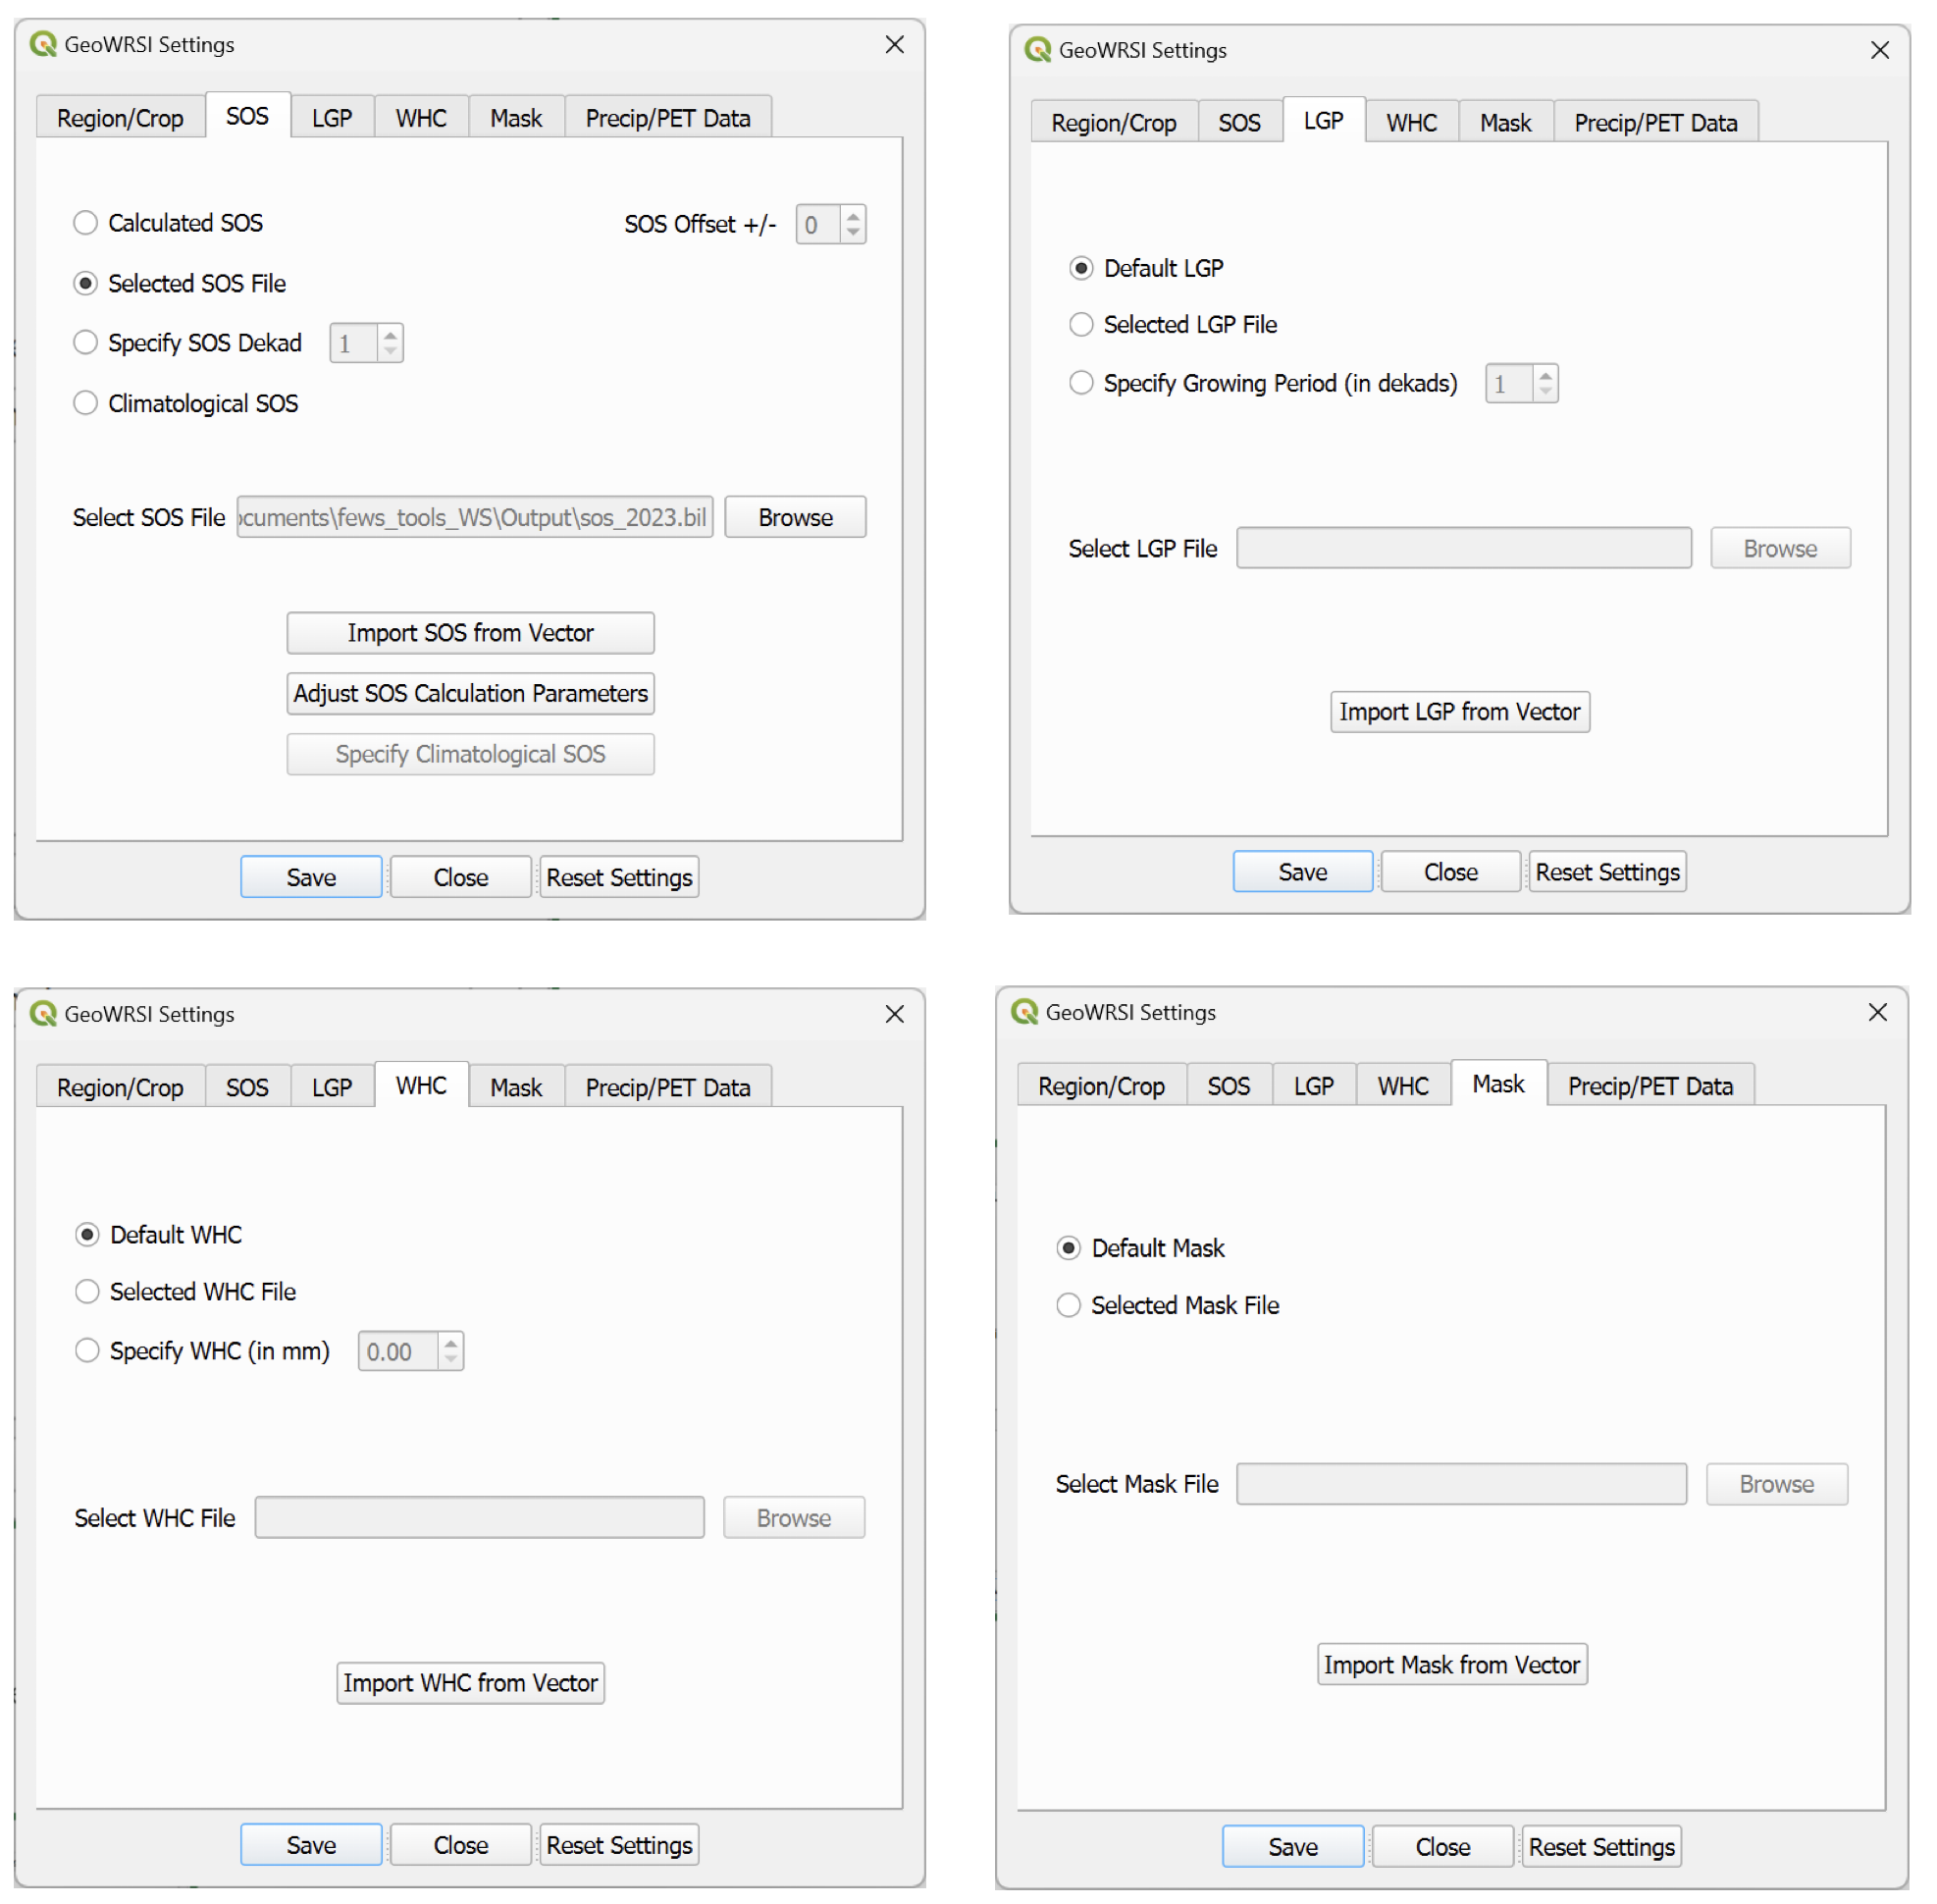
Figure 11-6 Continue selecting each tab and define the corresponding variable.
Worth special mention is the Precip/PET Data tab (Figure 11-7). Users need to ensure that they are running the WRSI model using the intended datasets. For example whether they are using CHIRPS or a locally improved rainfall dataset (See Chapter 9).
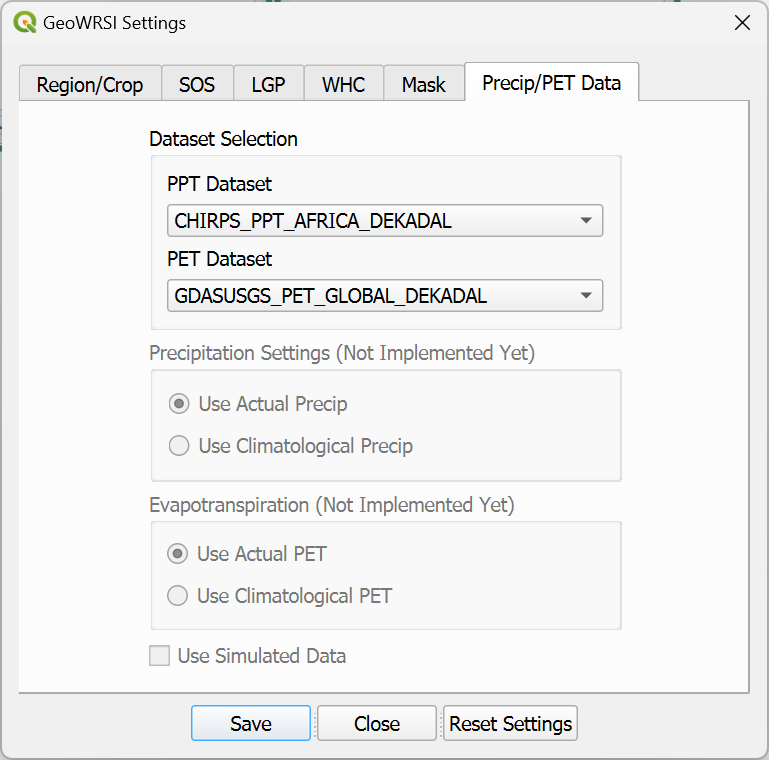
Figure 11-7 Finally select the precipitation and evapotranspiration.
11.2. Running the WRSI
To run the WRSI model, click the “Run WRSI” button (Figure 11-8).

Figure 11-8 Once the settings are defined, you are ready to run the WRSI.
The program prompts whether the precip (PPT) dataset contains a forecast period or not (Figure 11-9).
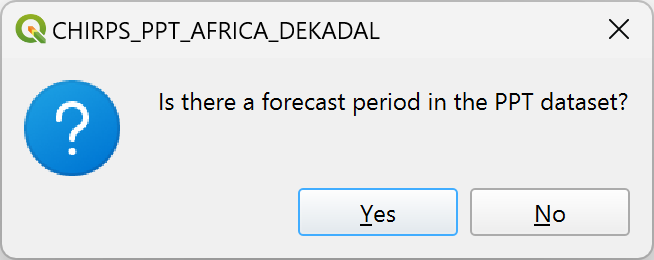
Figure 11-9 Confirm if there is precipitation forecast data.
Click no, unless you have downloaded and processed compatible forecast data. The forecast period function is a useful tool that allows you to forecast what the WRSI will be in the next period. Forecast period data are typically CHIRPS-GEFS, which is compatible with CHIRPS. To use the forecast period function, download a forecast dataset such as the CHIRPS-GEFS data from the CHC Products Collections.
Under “Start Year”, select the season/year for which to run the WRSI. The year referred to the year the WRSI run starts. So, for example, to run the WRSI for 2020/2021, select 2020, then click OK. The Water Balance model will start running. When it’s running, you will see a progress bar (% at the bottom).
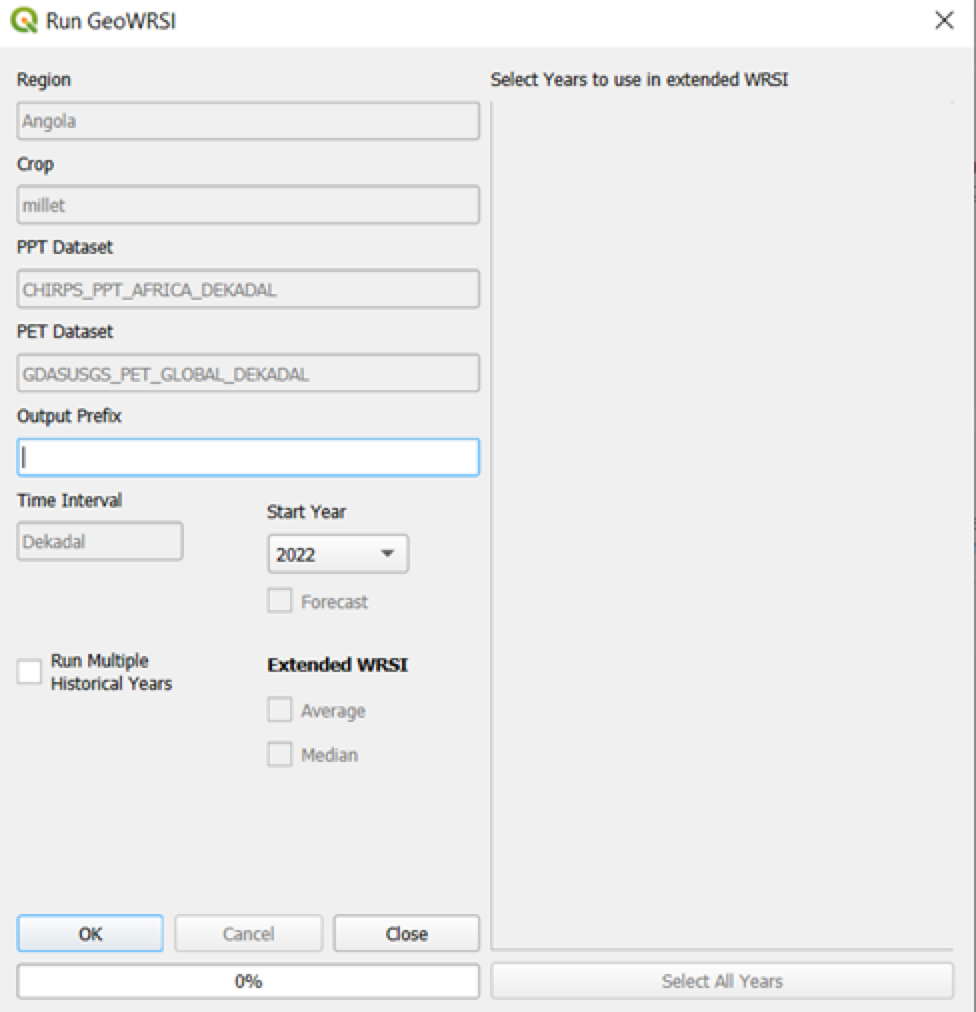
Figure 11-10 When ready, select the year and a prefix for the current run.
You can also run WRSI for multiple years by checking the “Run multiple historical years” box (Figure 11-11). The years options will appear on the right of the dialog box, allowing you to choose the years you want to run the WRSI.
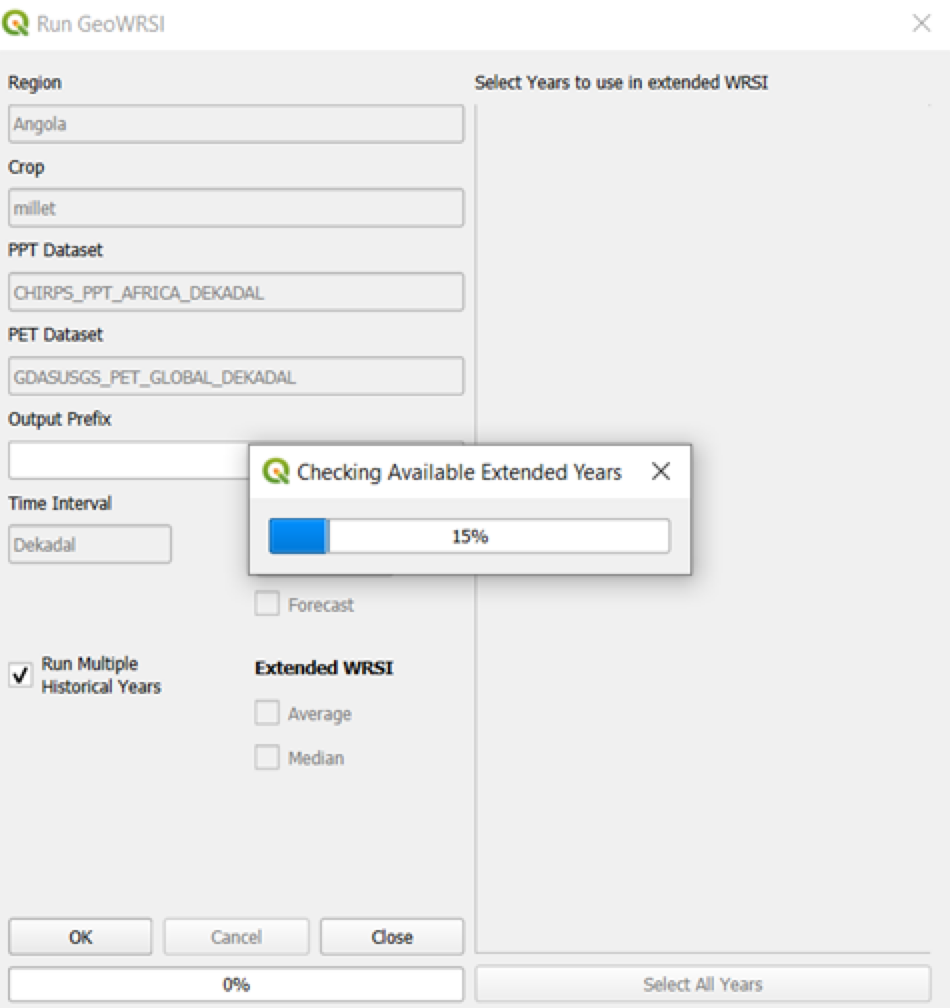
Figure 11-11 Select the Run Multiple Historical Years box if you want to run the process for many years.
Towards the end of the run, a dialog box will appear asking if you would like the animator to be initialized. You can click yes/no.
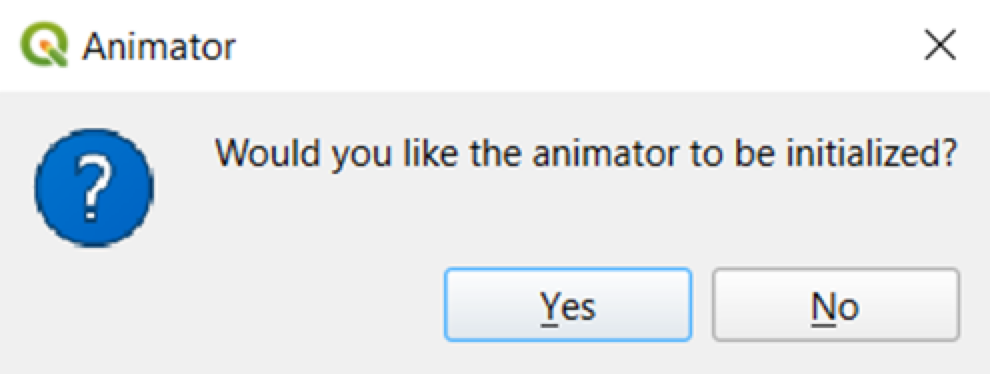
Figure 11-12 The animator facilitates navigating the data in the QGIS canvas.
The animator (Figure 11-13) enables display of the progression of the WRSI and other parameters over the course of the growing season. Clicking “yes” allows the animation of results to be displayed along with the other standard GeoWRSI outputs at the end of the run.
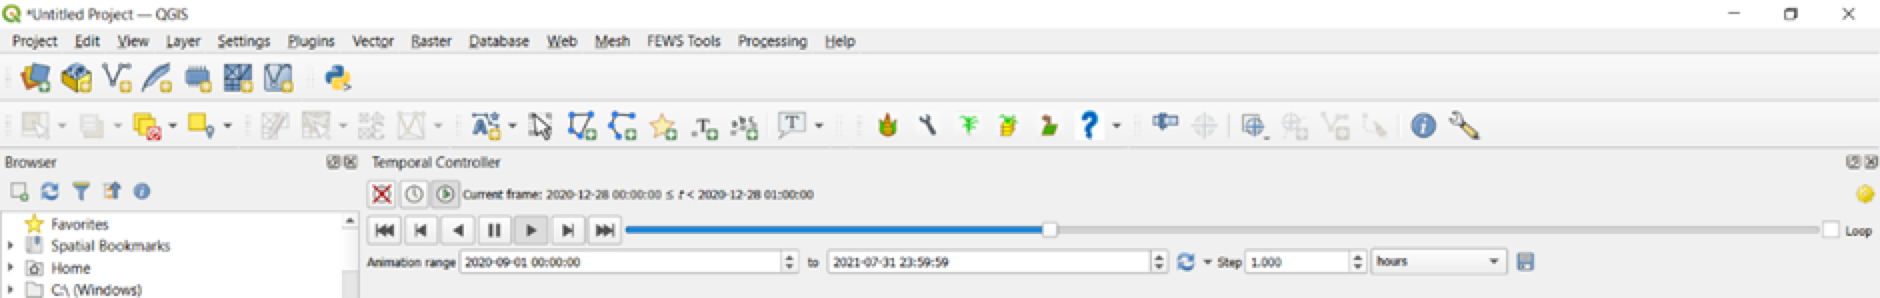
Figure 11-13 You can click forward/backward through the different WRSI products.
After completing the WRSI run, click ”No” to continue working with WRSI or “Yes” to close the window and view the results.
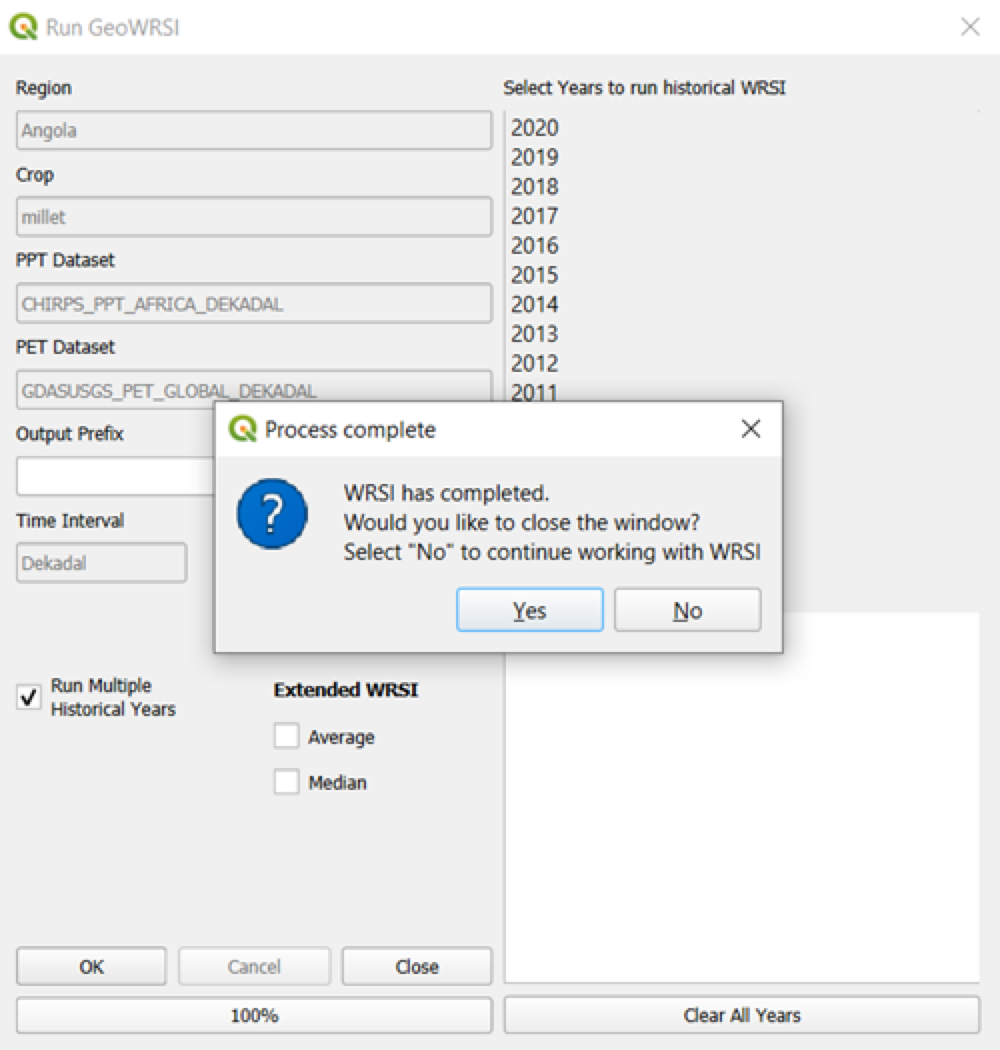
Figure 11-14 Close the window if you want to see the results.
Close the Run GeoWRSI window to see results. On the left side of the screen, you will find the Table of Contents with various parameters to select (Figure 11-15 and 11-16).
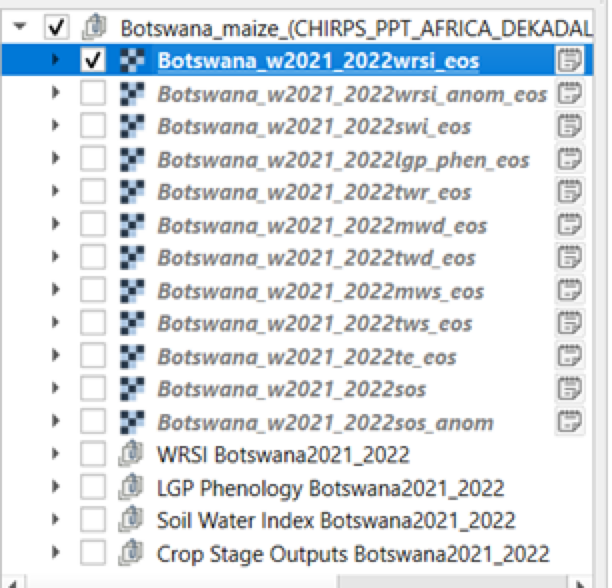
Figure 11-15 The layers panel of QGIS lists the different products
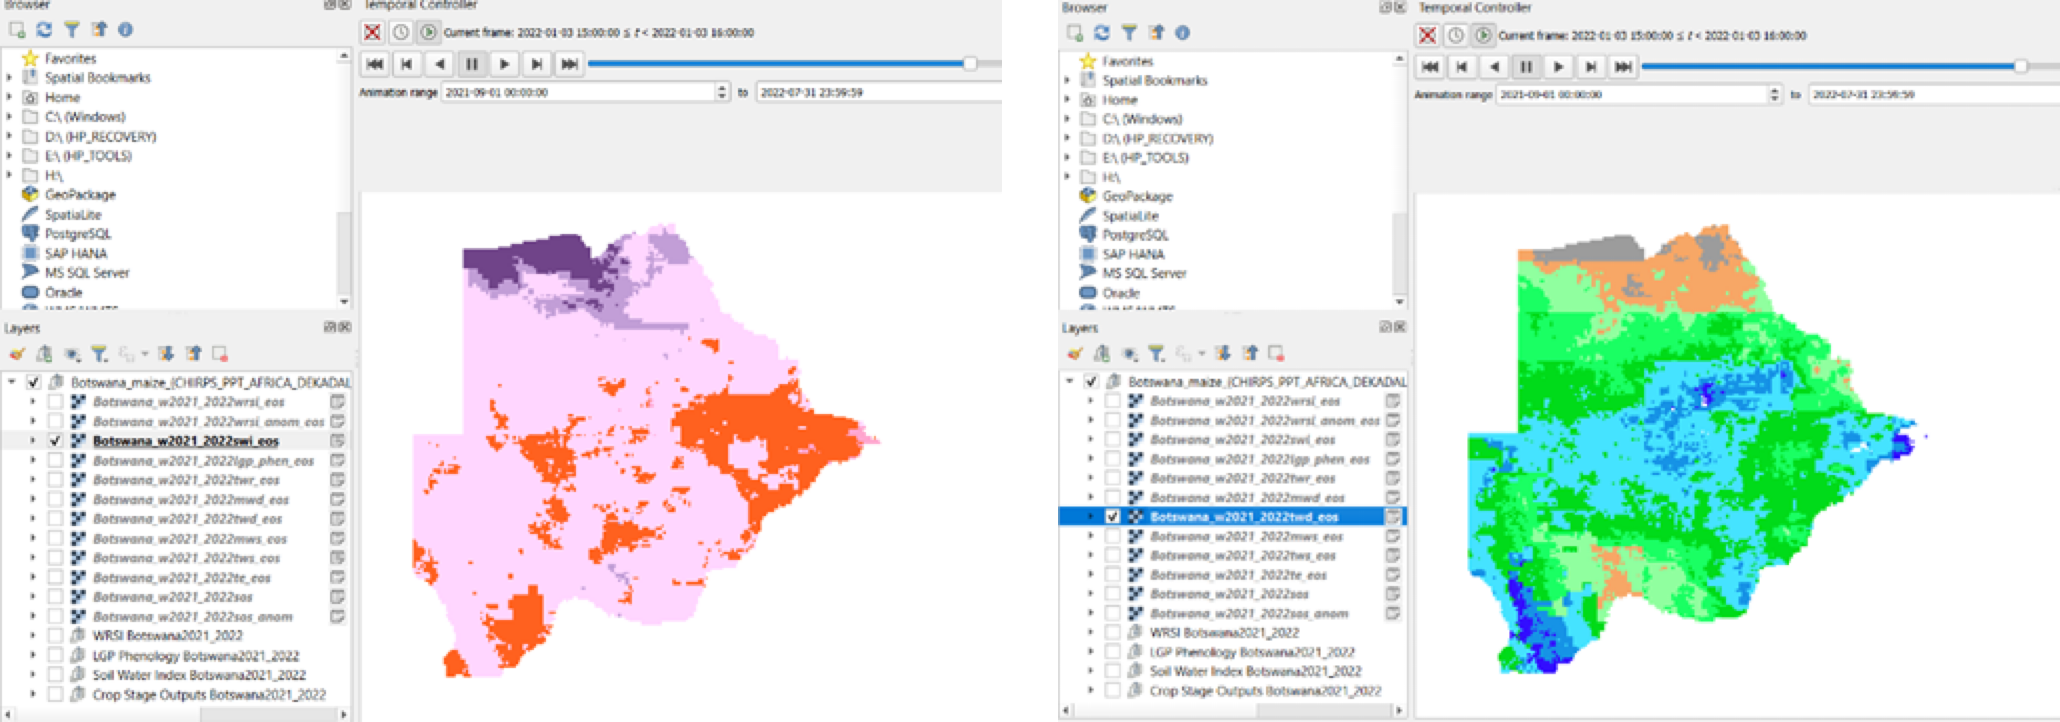
Figure 11-16 The canvas in QGIS shows the maps. Use the animator to navigate through the different products.
You can check the boxes next to them to view each parameter individually. Additionally, you can move the animator bar to observe outcomes at different times.