Chapter 5: View and Explore Rainfall Summaries
Summary

Figure 5-1 The Rainfall Summaries tool facilitates the calculation of total and anomalies for a season.
When analyzing a rainy season, it is important to estimate how different it is from average.
The Rainfall Summaries tool (red box in Figure 5‑1) facilitates the calculation of:
Current Period Total: total rainfall for the selected period.
Average Period total: long-term average for the selected period.
Difference from Average: (current period total – average period total)
Percent of Average: (current period total / average period total) *100
The outputs provide answers to questions such as, “What is the average for the period June dek1 to Aug dek3” and “How different was June dek1- Aug dek3 of 2012 from average?”
5.1. Requirements
To use the Rainfall Summaries tool, the selected climate dataset must have dataset averages available (see 4.2. Update Dateset Averages). These are the averages defined in the dataset definition form, see chapter 2 for more information. If the averages do not exist, a window message shows up, allowing you to open the Climatological Analysis of Climatic Variables tool to calculate the averages as follows: (See Figure 5‑2).
Select the dataset
Select all the periods
Select the number of years to be used in calculating the averages
Check the box update dataset averages.
The tool uses the information entered in the data definition form to calculate the averages for the domain of the dataset.
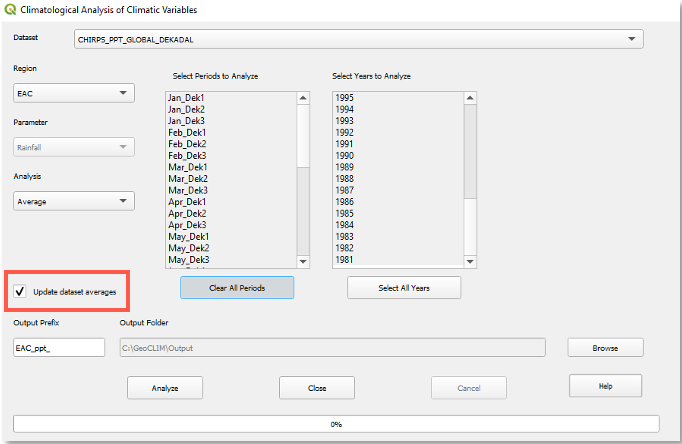
Figure 5-2 In order to calculate rainfall summaries you need to have averages for all the periods (pentads, dekads or months).
5.2. Calculate seasonal total and anomalies
Once the averages are available, close the Climatological Analysis tool to go back to the Rainfall Summaries tool, Figure 5‑3.
Select the period of analysis (defined by the From and To date)
Select the summaries to be displayed:
Current Period Total
Average Period Total
Difference from Average
Percent of Average
Click OK to run the tool
NOTE: You might have to edit the legend to represent your data better. See Intro to QGIS for how to edit the legend in QGIS.
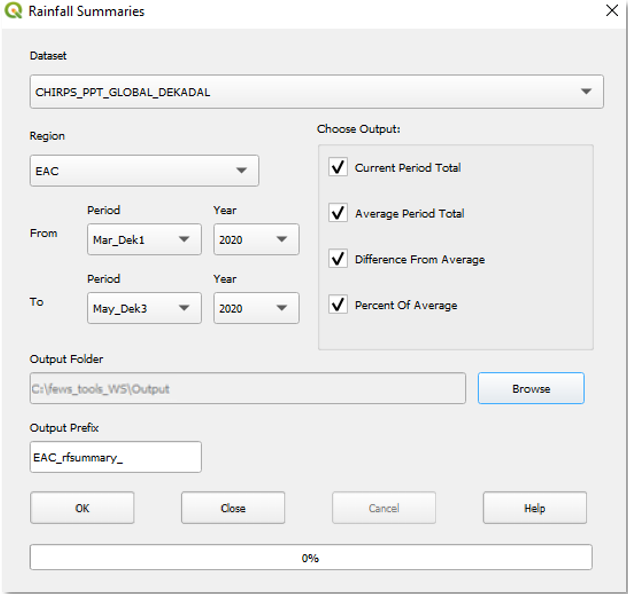
Figure 5-3 The Rainfall Summaries function facilitates the calculation of anomalies for a period.
NOTE: Even though the tool calculates all four products, it only displays the one you select.