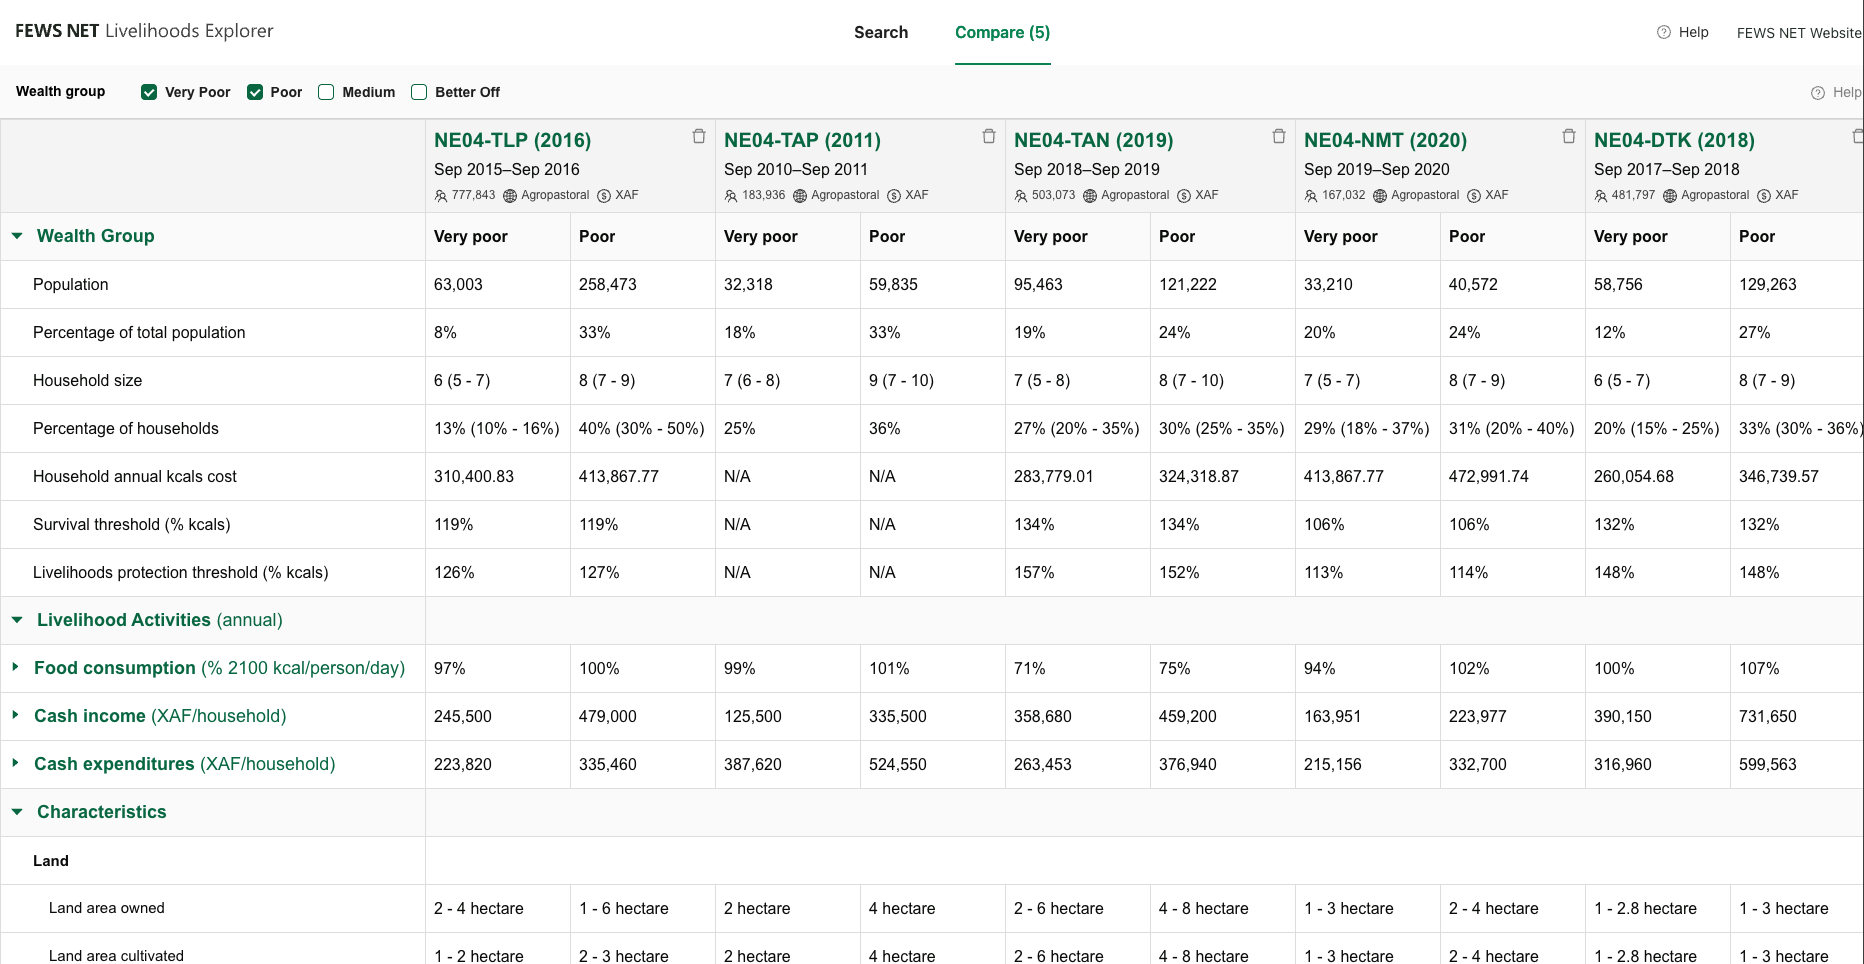

The Compare view can be used to compare detailed information across Wealth Groups, time, and/or different geographies.
LEX rounds percentage values to a whole number. This approach is used to avoid the suggestion of false precision as the data is based on interviews with a sample of the population. Because of this approach, sometimes the sum of the rounded numbers will not add up exactly to 100% (e.g., resulting in 99% or 101%).
Additionally, the data shown in LEX are reconciled values. Data is collected across a number of communities. Data collectors and analysts review the data and choose a single summary number that represents their expectation of a typical value for that group across all communities in the Livelihood Zone. These numbers are not direct calculations, but instead represent an expert opinion informed by collected and observed quantitative and qualitative data.
Some reconciled data contains both a point value and an interval value. Point values are used for calculations and most visualizations. Tables show intervals where available.
Adding Livelihood Baselines to the Compare view
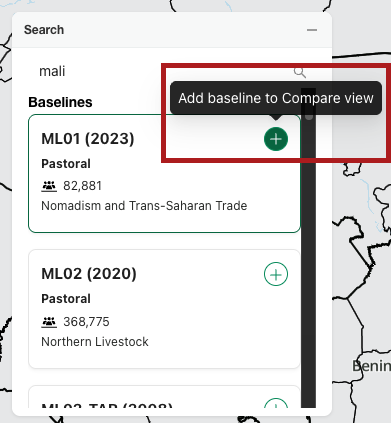
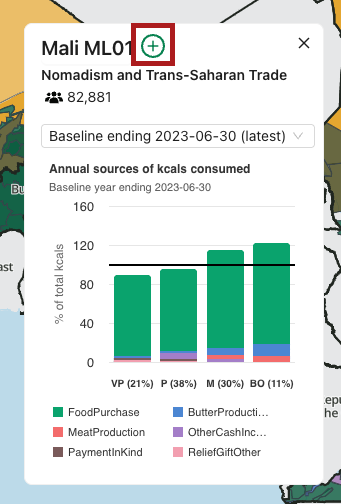
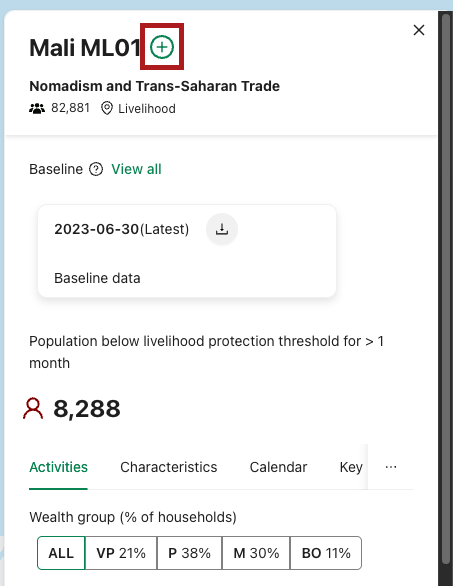
Livelihood Baselines can be added to the Compare View from a number of locations by clicking the plus button next to the Livelihood Baseline code.
Using the Compare view
The Compare view is a large, interactive table that allows you to view detailed information across multiple Wealth Groups and Baselines simultaneously. Once you have added the Baselines you are interested in to the Compare view, you can further refine the view by choosing which Wealth Groups to display information for.
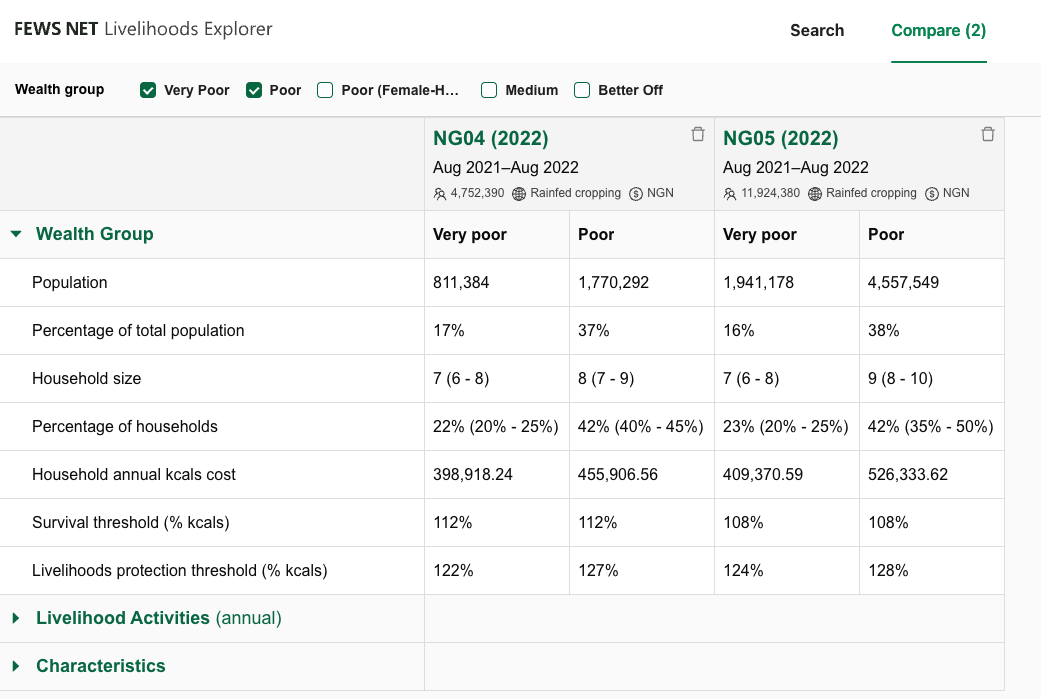
Each Baseline will have its own column header with the Baseline code, reference year dates, population, Primary Livelihood System, and currency. Each Baseline column is then split into sub-columns for each selected Wealth Group.
The following information is contained in the Compare table for each selected Baseline Wealth Group:
-
Wealth Group: The Wealth Group row set contains:
-
The population for the Wealth Group
-
The Wealth Group’s percentage of the total Baseline population
-
The household size as a point and interval value
-
The percentage of the Baseline’s households that Wealth Group contains as a point and interval value
-
-
Livelihood Activities: The Livelihood Activities row set contains statistics on Livelihood Activities utilized by the Wealth Group in the reference year. All Livelihood Activity data are point values. They include:
-
Food sources reported as a percentage of food needs (2100 kcal/person/day)
-
Cash income sources and expenditures reported by household, using the currency indicated in the Compare view
-
-
Characteristics: The Characteristics row set contains a list of Wealth Group characteristics such as amount of land owned, number of cows or mobile phones, number of children in school or people working. Characteristics are range values where available and reported at the household level.
Use cases
A broad view of data for one Livelihood Zone Baseline
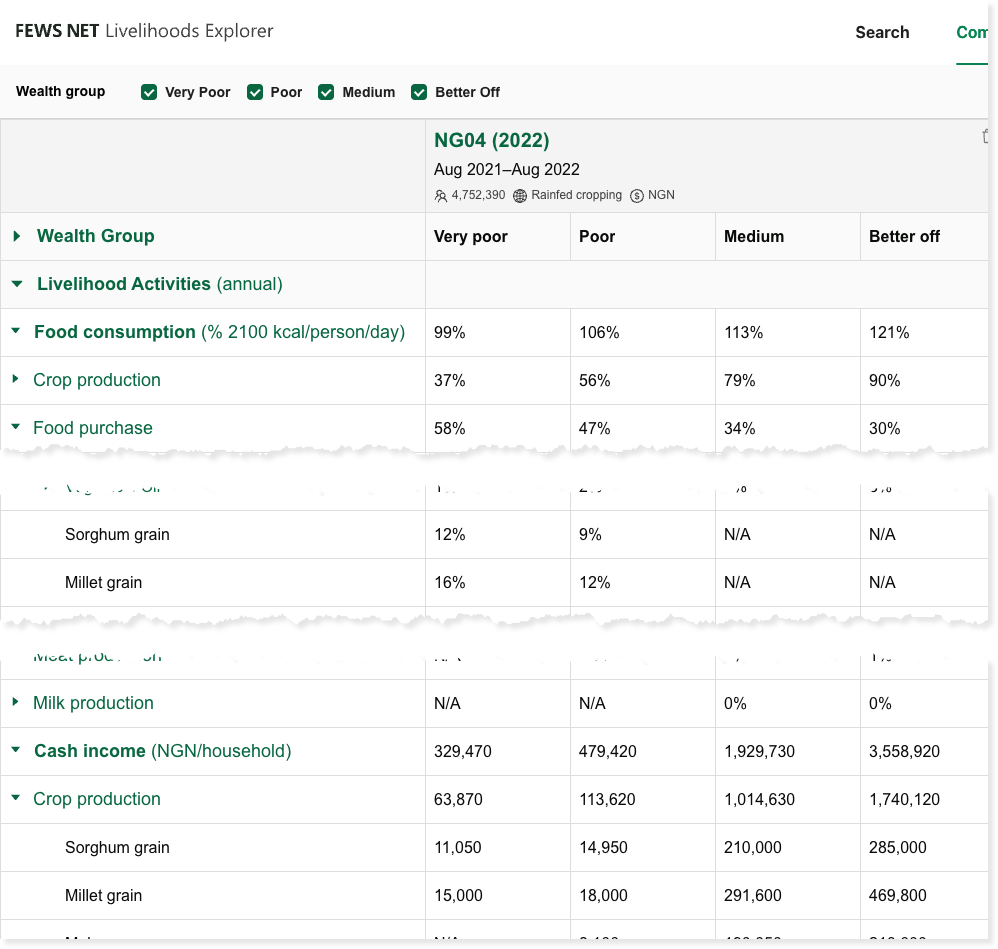
Adding a single Livelihood Zone Baseline to the Compare view allows you to dig deeper into the data for the Livelihood Zone. You can easily compare food consumption, income, expenditure, and wealth characteristics across Wealth Groups to gain a deeper understanding of how people relate to their environment and each other to make ends meet.
In this example, you can easily see how the Very poor and Poor Wealth Groups rely on the purchase of sorghum and millet, both of which contribute to a significant amount of cash income for the Medium and Better off Wealth Groups.
Compare Baselines across multiple Livelihood Zones
This view can be used to compare:
-
Relative dependence on certain Livelihood Activities or products as sources of kcals and/or income
-
Relative income, expenditure, and/or kcal total levels across Livelihood Zones
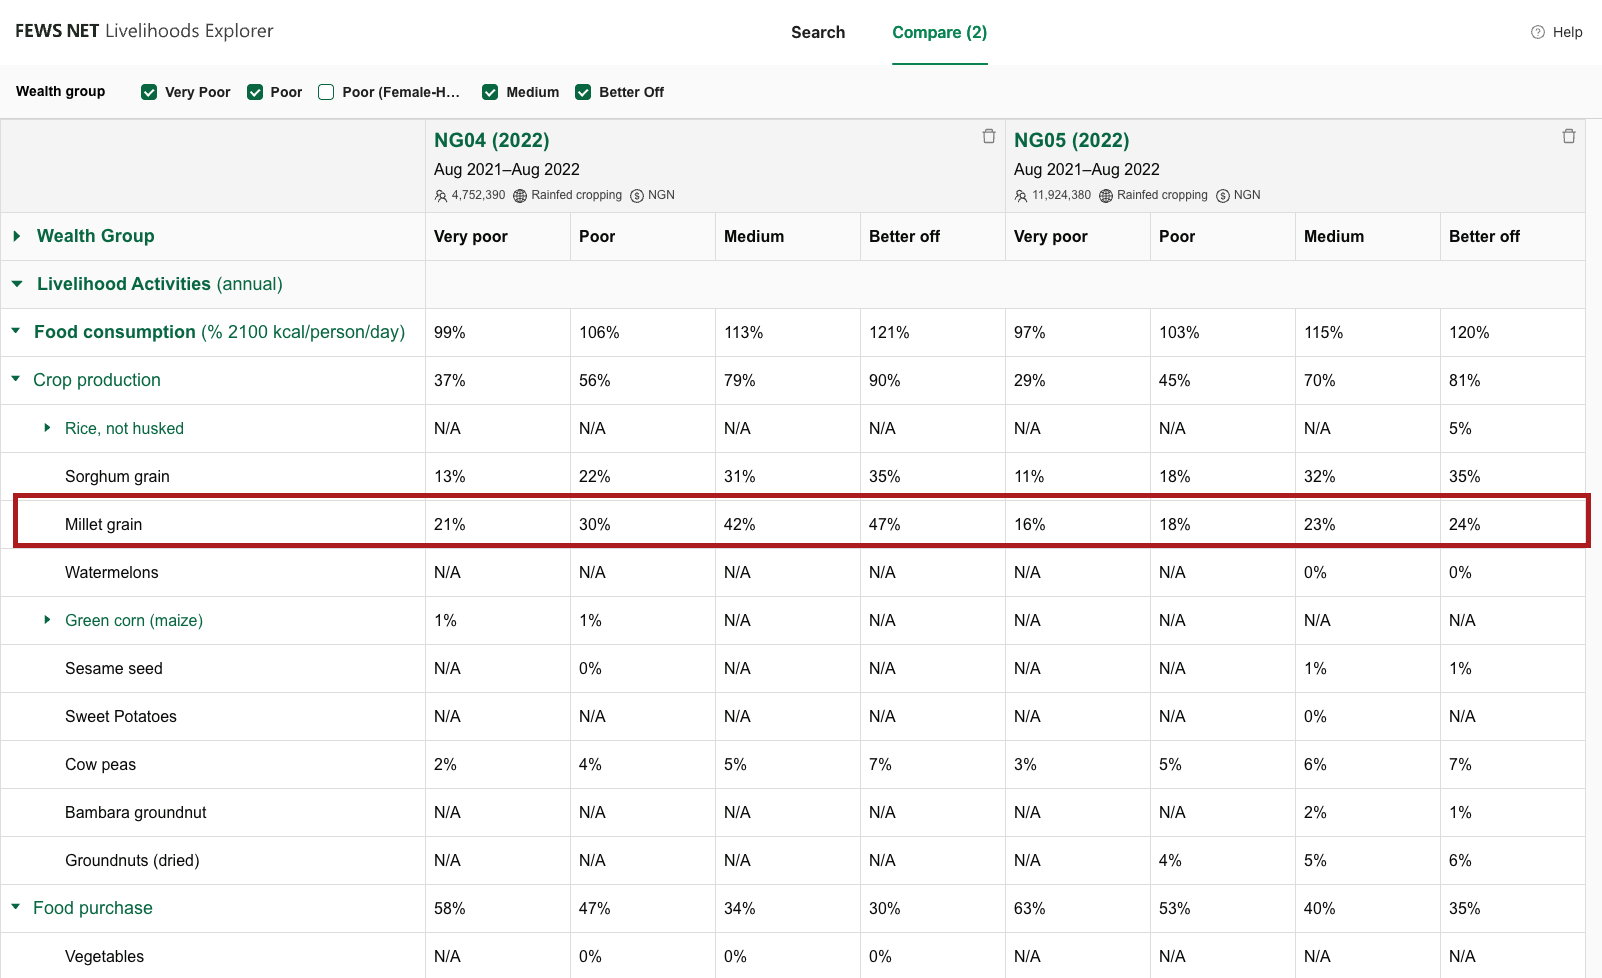
By selecting multiple Baselines, you can get a picture of which Livelihood Zones may be most affected by a shock.
In this example, you can see that NG04 has a heavier reliance on millet than NG05.
Compare Baselines over time for one Livelihood Zone
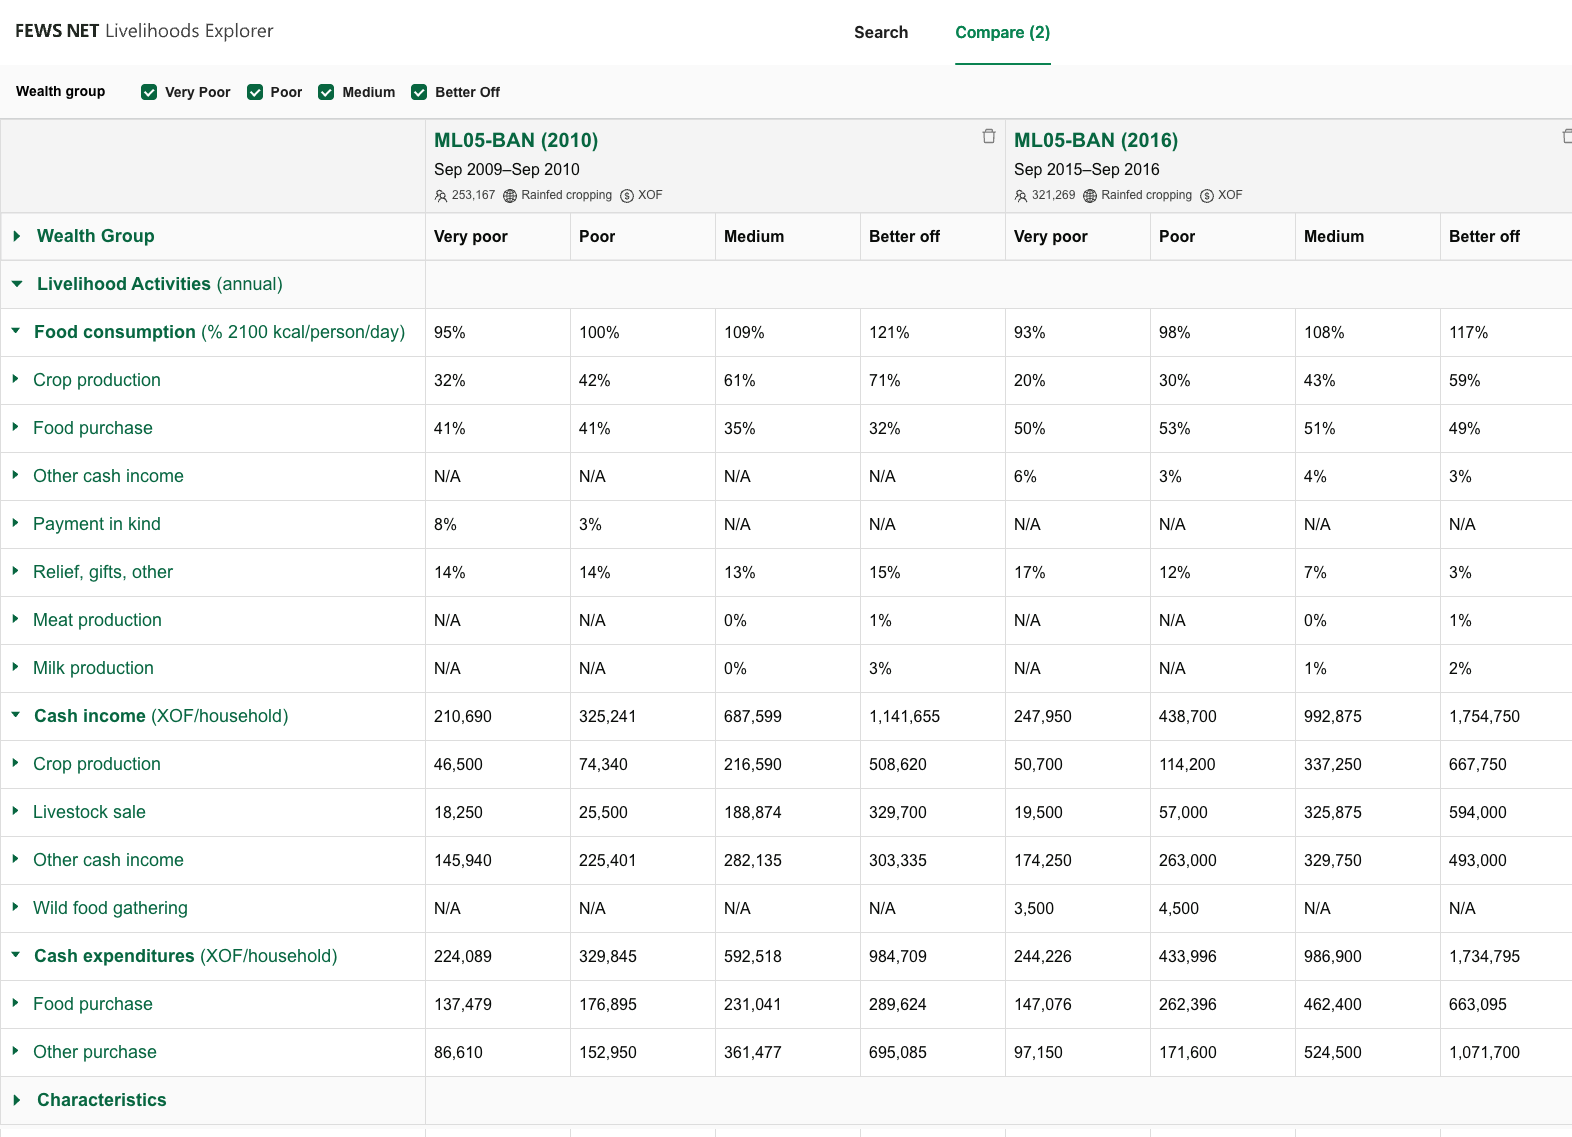
Comparing Baselines for a single Livelihood Zone can show how things have changed over time in a specific location.
In this example you can see a decreasing reliance on crop production for food and an increasing reliance on food purchases for all Wealth Groups fueled by:
-
An increase in relief and gifts to the Very poor
-
Increased importance of sales of crops and livestock
-
Increased importance of other income-generating opportunities, especially for the better off groups
Compare Baselines over space for one Livelihood Zone
Some Livelihood Zones in Niger span the entire near 1500 km length of the country, making typical livelihood baseline data collection difficult. In this case, organizations may decide to create multiple baselines representing parts of these large zones. LEX makes this comparison possible and easy, as shown in the example below.