
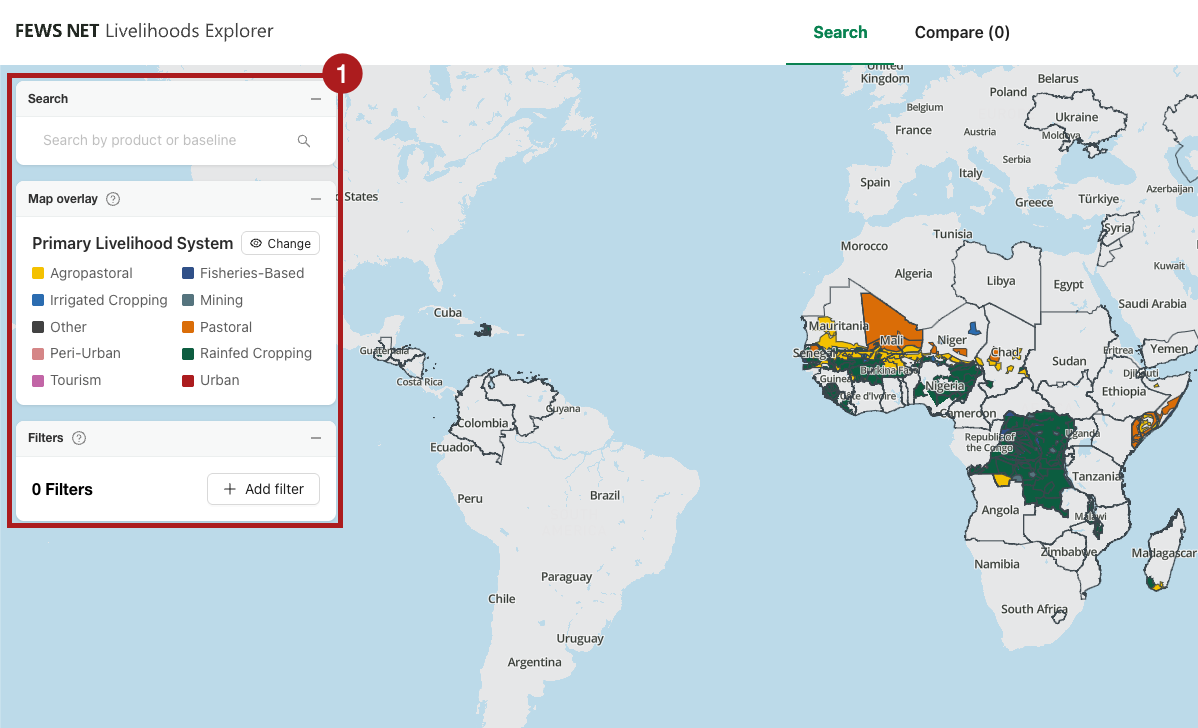
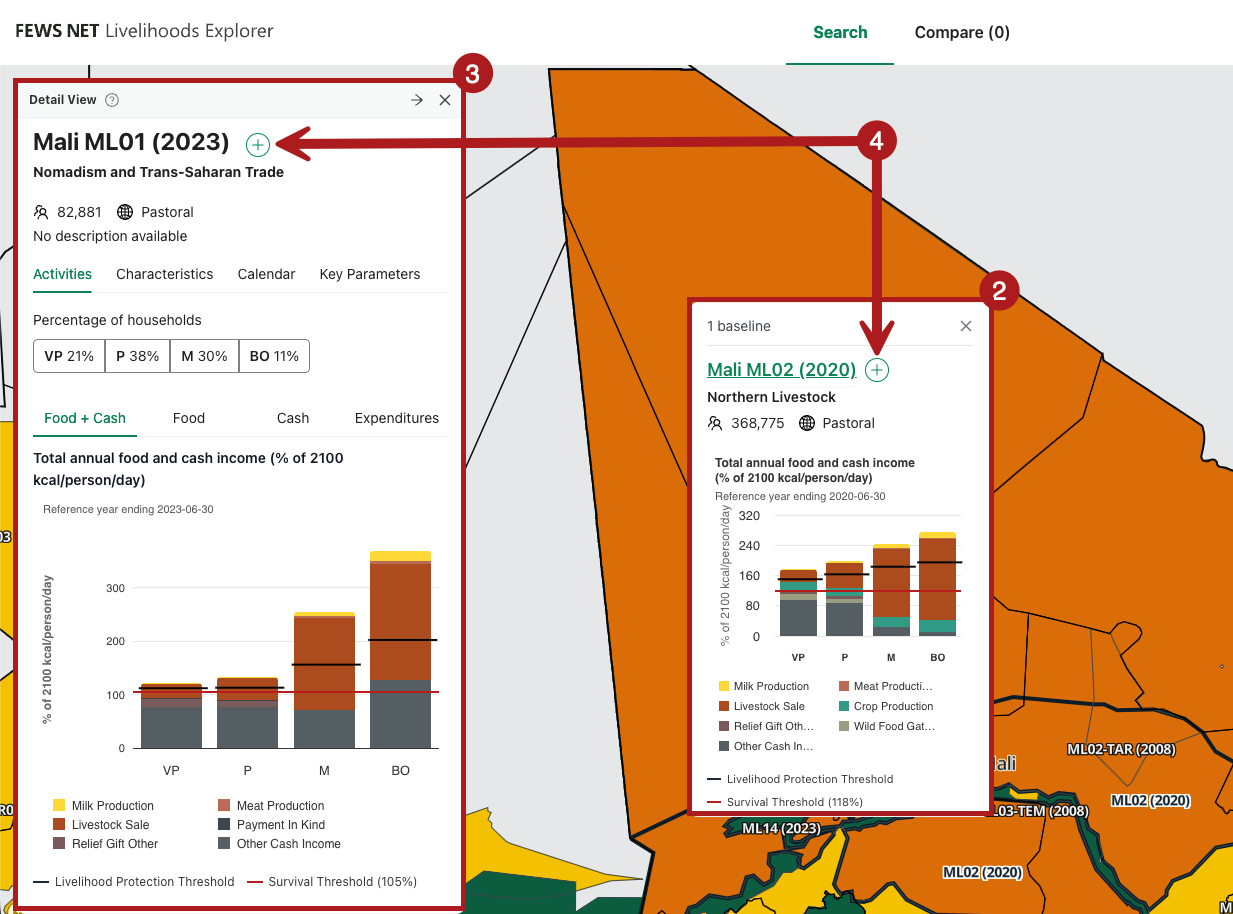
The map in the Livelihoods Explorer is the main interface for selecting and viewing Baseline data. From the map you can:
-
Search and filter Baselines
-
Click on a Livelihood Zone from the map to open a Quick view card for a Baseline.
-
Click on a Livelihood Zone code from the Quick view card or from the search results to open the detailed Baseline Summary card.
-
Click the plus button next to a Baseline name to add it to the Compare screen.
You can also quickly compare two Baselines by opening a Baseline Summary card and then opening a Quick view card for a different Baseline from the map.
Search
You can search within the Livelihood Explorer side bar for a specific Baseline or for filters. Search results may contain a combination of the two.
When performing a search, results appear ordered by relevance. Filters appear first, followed by Baselines.
Example
Searching by maize will return the following:
Filters
-
Maize/corn grain product filter
-
Green corn (maize) product filter
-
Maize flour product filter
Baselines
-
All Baselines with maize in the name of the corresponding Livelihood Zone, such as HT01: Dry Coastal Maize and Charcoal.
Clicking on a Baseline in search will open the Baseline’s detail view. Search Baselines by:
-
Country: Country name or 2 letter code
-
Code: The code of a specific Baseline, e.g. ML01 (2023)
-
Livelihood Zone: The name or code for a specific Livelihood Zone, e.g. ML01
-
Primary Livelihood System: The predominant type of Livelihood in a Livelihood Zone, e.g. Agropastoral
Clicking on a filter in search will either add the filter (Location or Primary Livelihood System filters) or open the filter edit view (Livelihood Strategy filter). Search filters by:
-
Product: e.g. maize, goat’s milk, or skilled labor
-
Livelihood Strategy Type: e.g. crop production, food purchase, or wild food gathering
-
Primary Livelihood System: The predominant type of Livelihood in a Livelihood Zone, e.g. Agropastoral
-
Country: Country name or 2 letter code
Watch the short video below to see how a filter can be added from search. (0:28, no audio)
Map overlay
Overlays are predefined attribute map views. Rather than filtering out Livelihood Zone Baselines that do not meet the criteria, they instead show how a specific criteria maps across all currently visible Baselines.
The default overlay visualizes the Primary Livelihood System for each Livelihood Zone Baseline. LEX contains the following Primary Livelihood System options:
-
Pastoral: Livelihoods primarily based on livestock production; seasonal mobility/transhumance often present.
-
Agropastoral: Mixed crop and livestock production, both significant sources of food and cash income.
-
Rainfed Cropping: Cropping dependent mainly on rainfall with little or no managed irrigation.
-
Irrigated Cropping: Cropping reliant on controlled or managed water (canals, pumps, diversions).
-
Fisheries: Livelihoods centered on fishing or aquatic resource harvesting.
-
Agro‑Fisheries: Mixed fishing and crop production, with fishing as the dominant source of food and cash income and cropping as a significant but secondary component; at least 25% of cash income (not food) for the majority comes from fishing (including fishing labor, which is more important in coastal fishing).
-
Urban: Income mainly from wages, informal employment, services, trade, and other self-employment in towns/cities.
-
Peri‑Urban: Transitional areas near cities with mixed urban income and limited agriculture/livestock.
-
Labor‑Based Agricultural: Livelihoods depend primarily on seasonal or annual wage labor provided to large commercial or estate‑based agricultural enterprises, rather than producing their own crops or livestock; income comes mainly from unskilled, semiskilled, or skilled agricultural labor, and households typically have minimal or no independent primary production.
-
Specialized Natural Resource: Livelihoods dominated by a specialized activity not covered above (e.g., mining, forestry, tourism, hunting‑gathering).
All other overlays use a different set of percentages to categorize Baselines based on the available data for that category. The percentages are calculated for the selected Wealth Group(s). If a percentage is 0 for the selected Wealth Groups in a Livelihood Zone, that area is mapped in white.
Percentage overlays include:
-
Percentage of food consumption from own crops
-
Percentage of food consumption from purchase
-
Percentage of cash income from crop sales
-
Percentage of cash income from livestock sales
-
Percentage of cash income from labor
Choose a Wealth Group
When choosing a strategy filter or one of the percentage overlays, a Wealth Group filter option becomes available. Changing this filter will change the map view, including the percentages used to categorize Baselines. This filter is set to All Wealth Groups by default.
Learn more about Wealth Groups.
Example
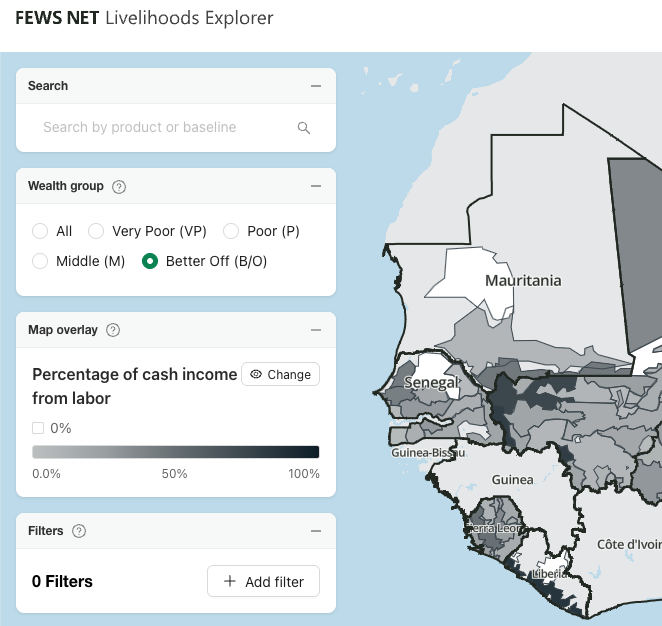
In this example, the Percentage of cash income from labor overlay is selected.
Viewing data for the Very poor Wealth Group shows a heavy reliance on labor for all Livelihood Zones in west Africa.
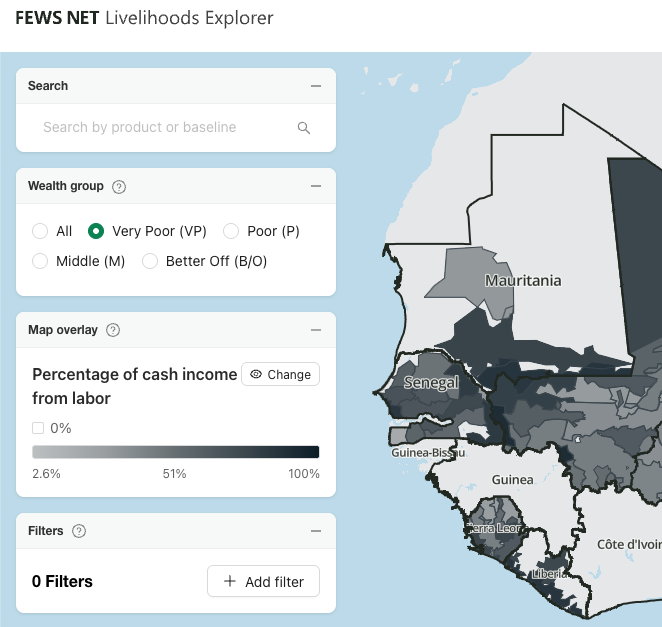
Viewing data for the Better off Wealth Group shows a lower reliance on labor for the same area, as low as 0% in some areas.
Filter
Using a filter creates a custom map overlay. Baselines that do not meet the criteria defined by the filter are mapped in white. Filters can be added via search or the Add Filter button.
Filters include:
-
Strategy: Filter zones by Livelihood Strategy Type, e.g. crop production, food purchase, or wild food gathering. You can refine this filter in three ways:
-
Product: You can specify products. For example, after choosing the milk production strategy, you can choose specific animal milks to further refine your search to just goat’s milk production.
-
Type of contribution: You must specify if the strategy contributes to calorie consumption (Food), income (Cash), total income (Food + Cash), or expenditure.
-
Amount of contribution: You can further specify the maximum and/or minimum contributions to a food, cash, and/or expenditure.
-
The strategy filter is cascading. This means that when you choose a strategy the following filters are refined accordingly. For example, if you choose milk production, the product filter will only show relevant milk products such as cow’s milk and goat’s milk. Products such as cassava will not appear as options in the product filter.
-
Primary Livelihood System: Filter by type of Livelihood Zone, e.g. Agropastoral
-
Population: Filter zones by the total population
-
Location: Filter by country or region
Using overlays and filters in combination
Overlays and filters can be used in combination. The Livelihoods Explorer will map a combination of the two options using “and.” That is, Livelihood Zones that do not meet the criteria for both the filter and the overlay will be mapped in white.
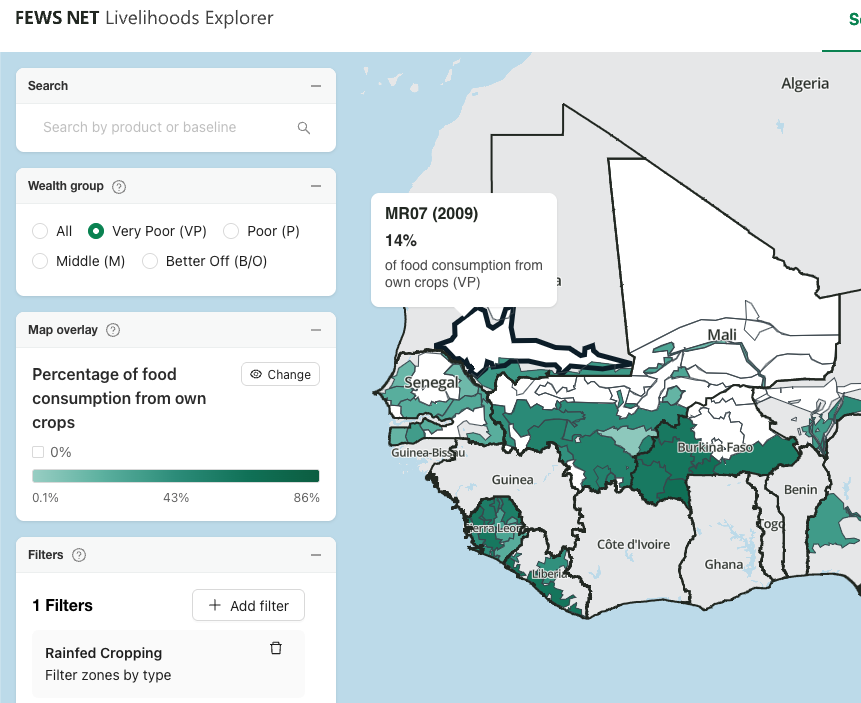
This can create a scenario where areas may be mapped in white for either or both of the following reasons:
-
The Livelihood Zone does not meet the criteria defined by the filters
-
The percentage for the criteria set by the overlay is 0 for the selected Wealth Groups in a Livelihood Zone
Use the tooltip to determine the reason why an area is mapped in white.
In ML01, the percentage of food from own crops is 0. Since its Primary Livelihood System is Pastoral, it meets both of the criteria for mapping in white.
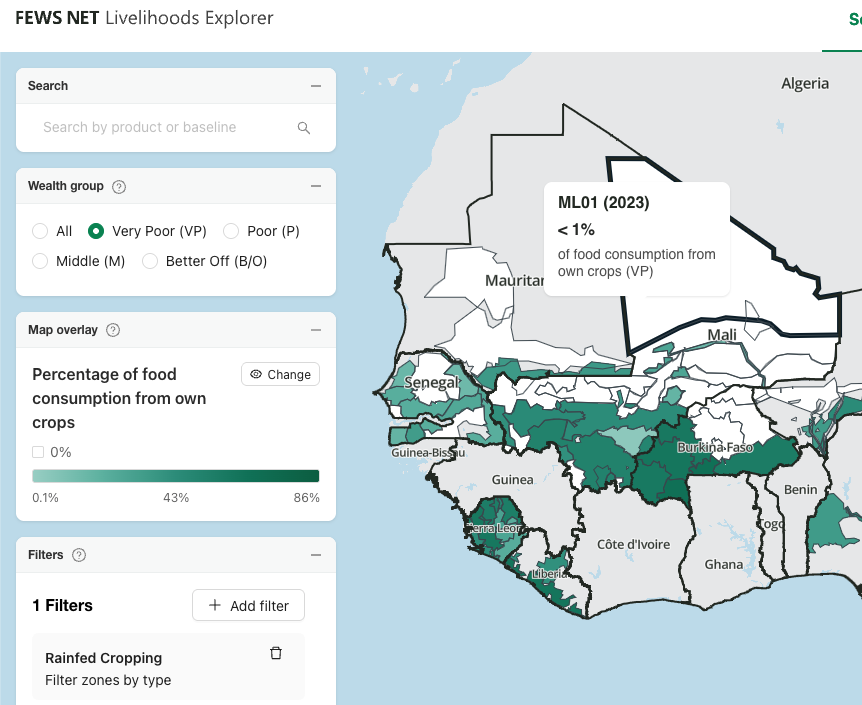
MR07 receives 14% of its food from consumption of own crops. Therefore it is mapped in white solely because its Primary Livelihood System is not rainfed cropping.