
Visualize Primary Livelihood Systems around the world
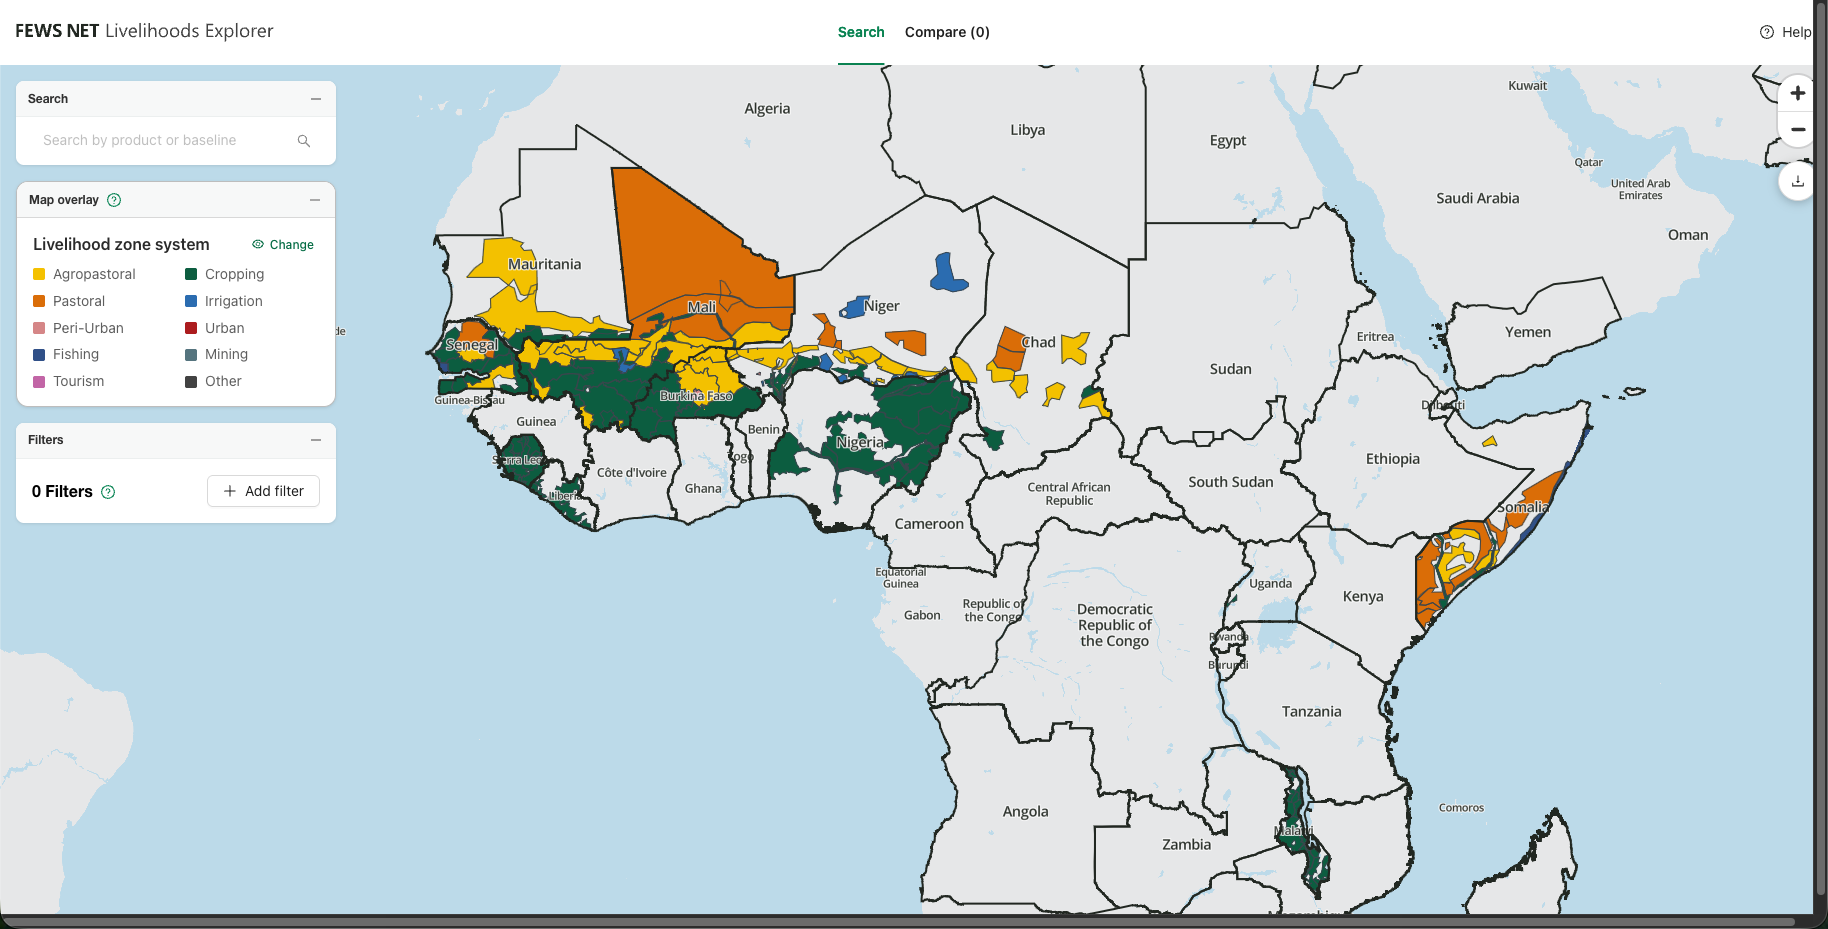
LEX allows for easy visualization of the relative locations of Primary Livelihood Systems across multiple countries around the world simultaneously.
The landing page shows global map of Livelihood Systems for all Baselines currently in the database.
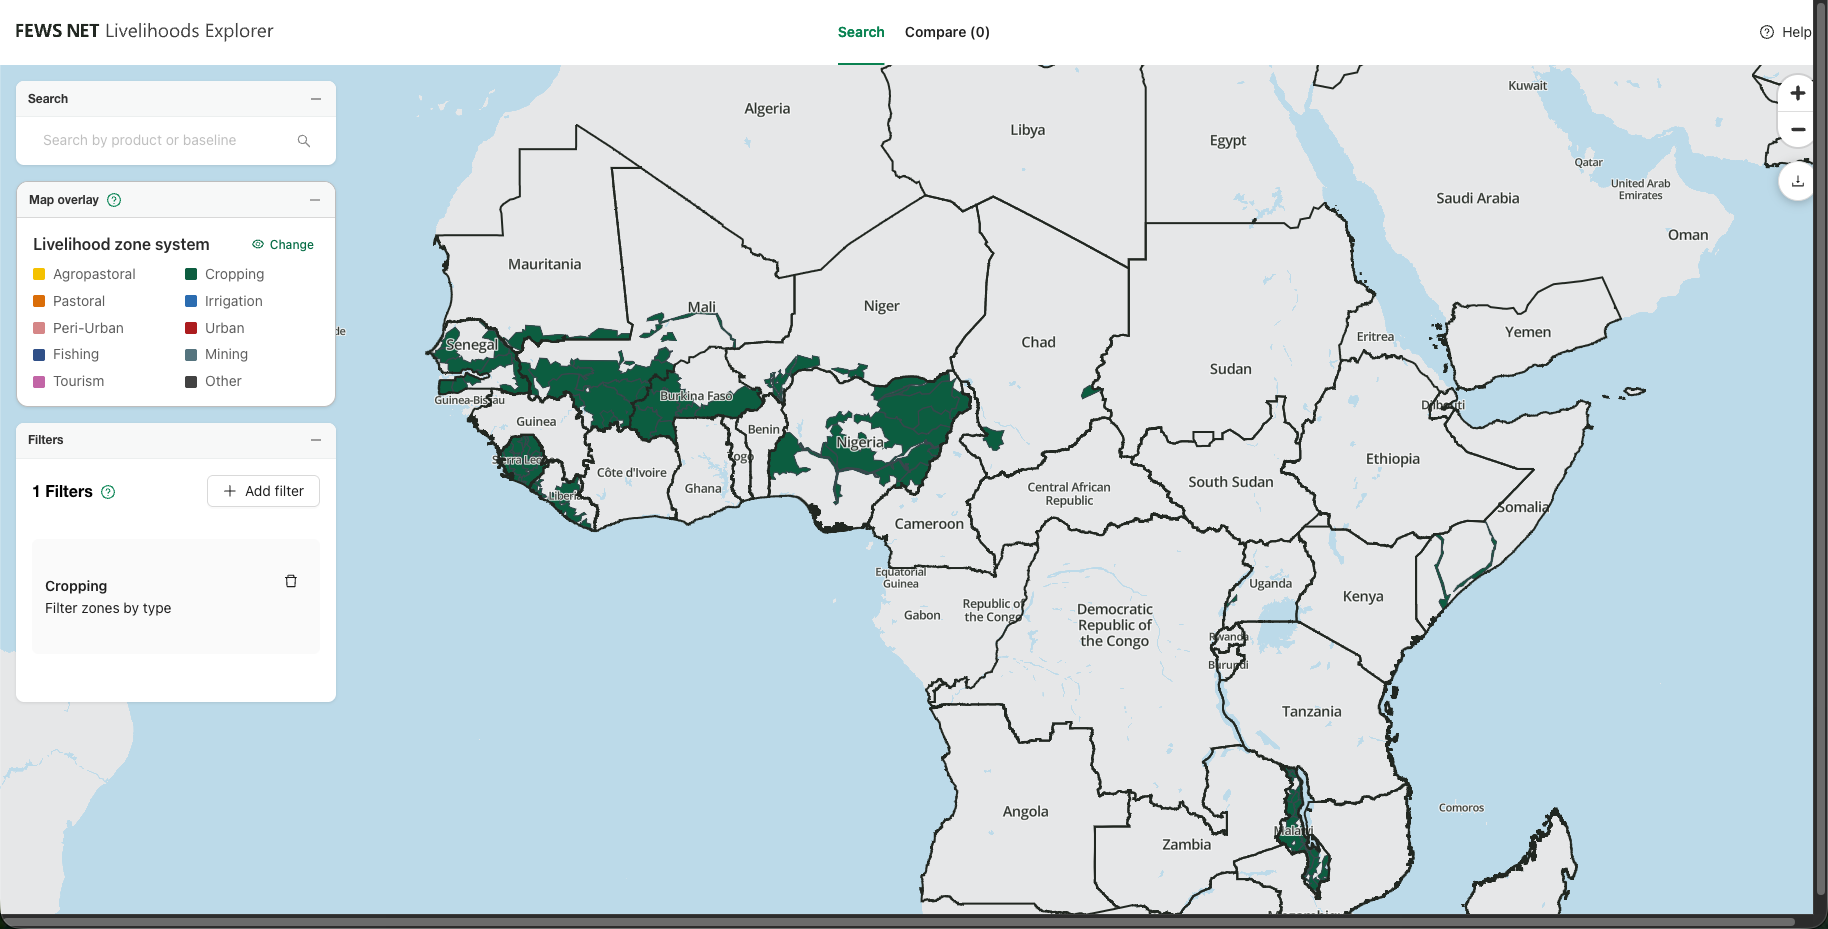
You can filter the view to show only those areas with Baselines of one type of Primary Livelihood System. This helps to answer questions like: where in the world do people depend relatively more on rainfed cropping, irrigated cropping, livestock, or fishing?
View the relative importance of Livelihood Strategies
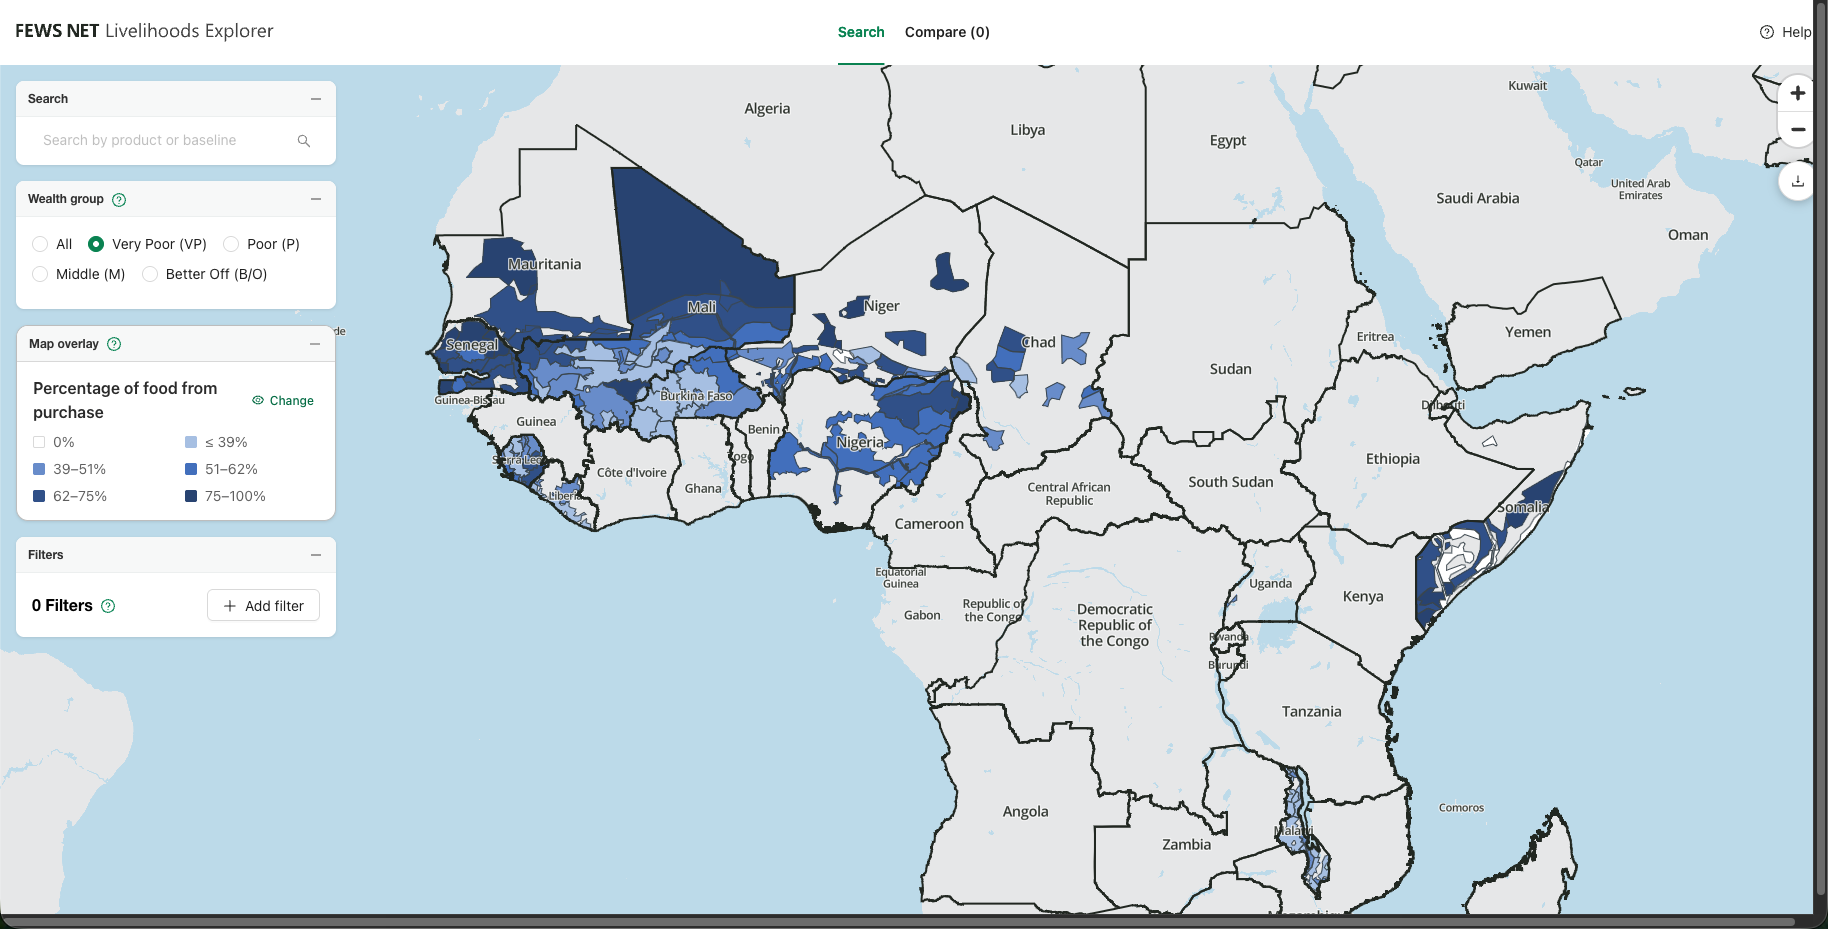
Changing the overlay allows for the visualization of the relative importance of different Livelihood Strategies across multiple Livelihood Zones and countries around the world simultaneously.
This example shows the percentage of food purchased by the Very poor Wealth Groups in a Livelihood Zone. This helps to answer questions like: in which areas will the very poor be most vulnerable to acute food insecurity as a result of an increase in global cereal prices?
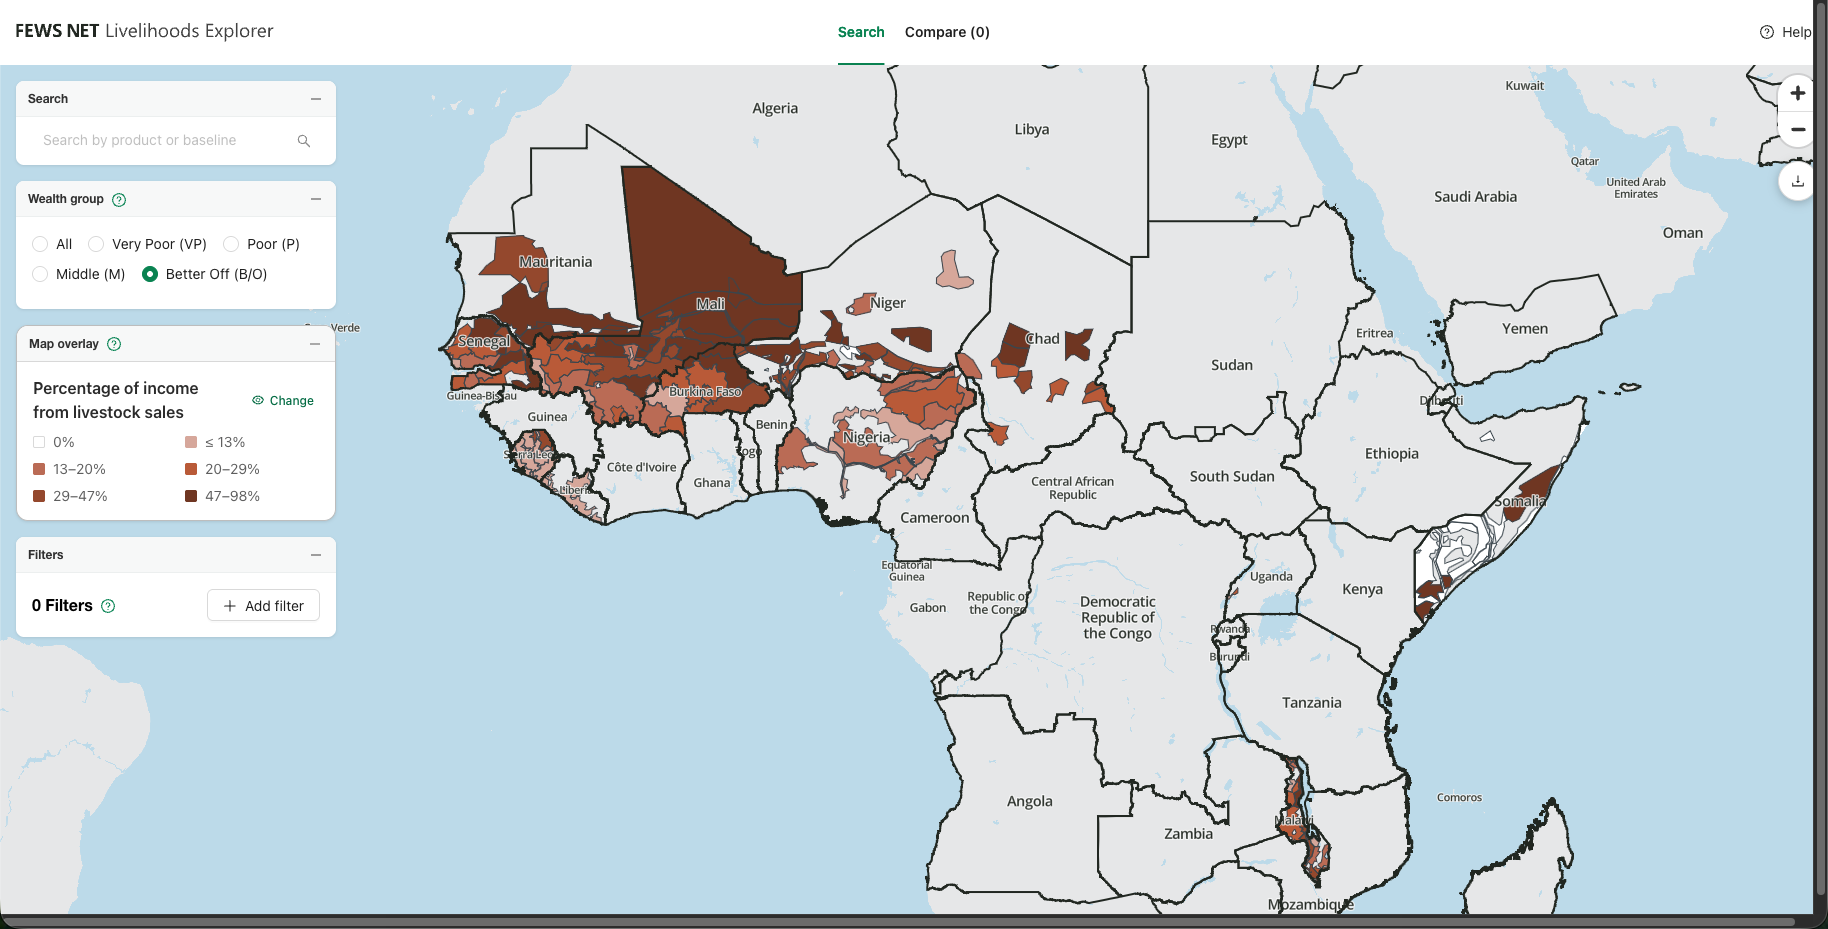
This example shows percentage of income from livestock sales for the Better off Wealth Groups. This helps illustrate areas that are most vulnerable to livestock diseases or possibly changes in livestock trade policies.
View the relative importance of a product
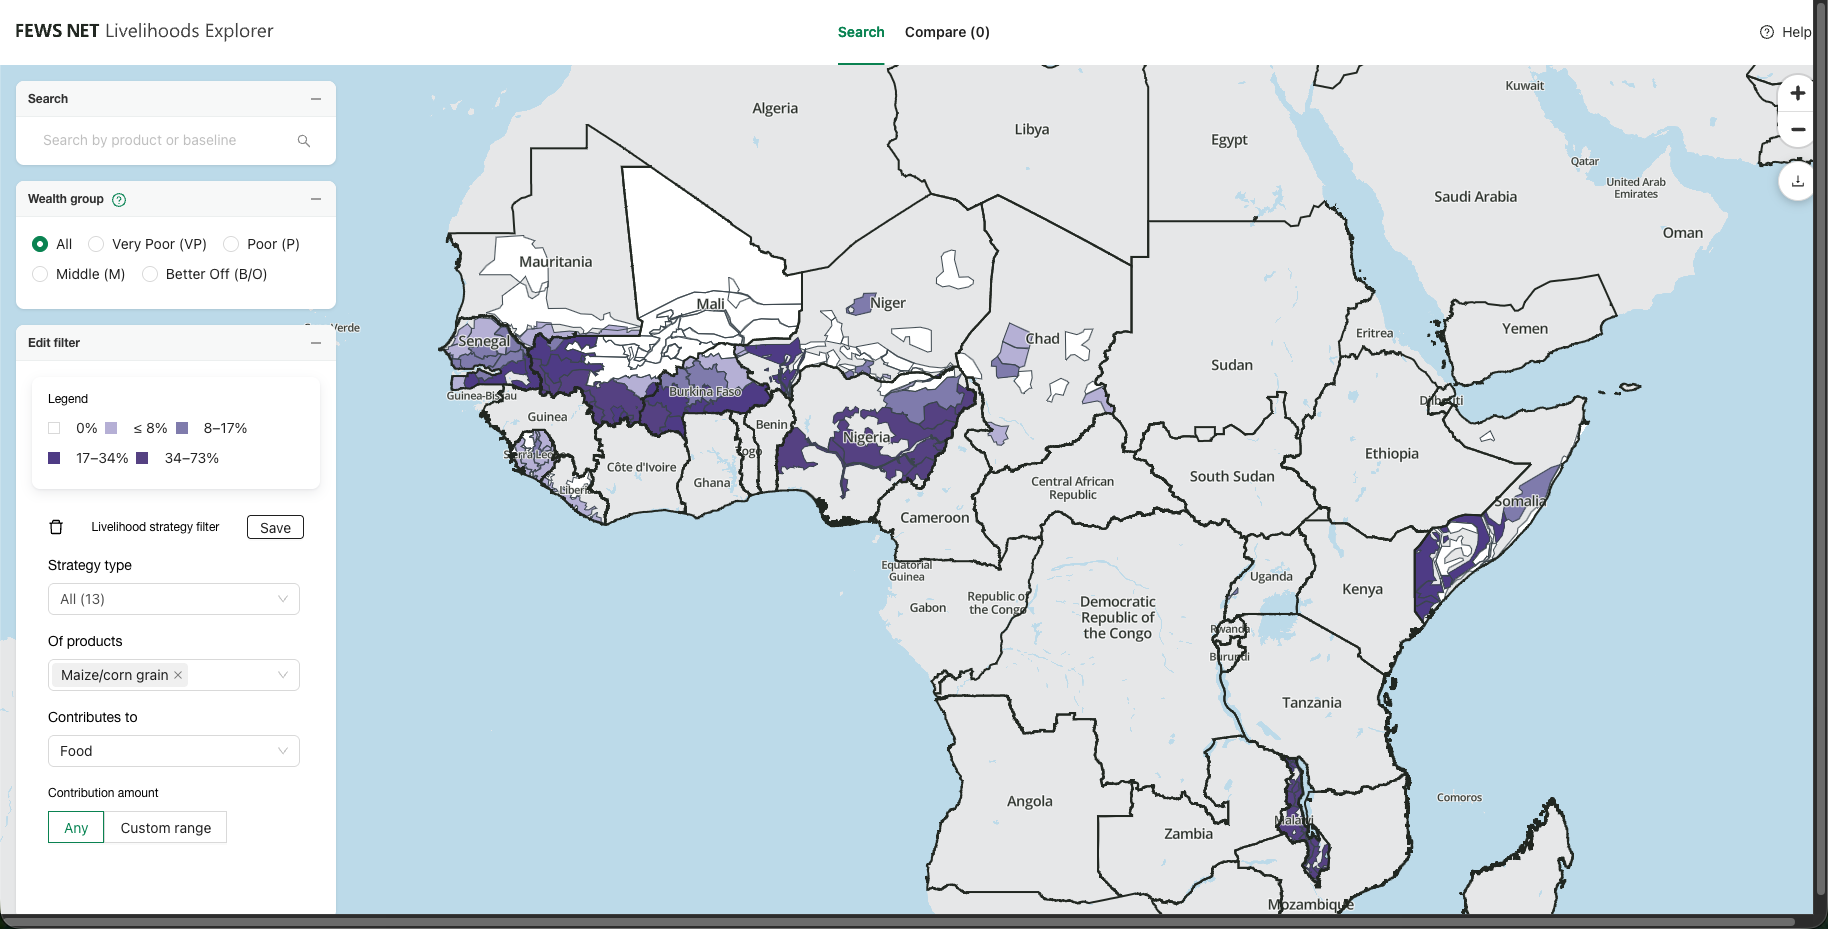
Adding a product filter allows for the visualization of the relative importance of specific livelihood products across multiple Livelihood Zones and countries around the world simultaneously. This example shows where people are most dependent on maize grain to meet energy needs.
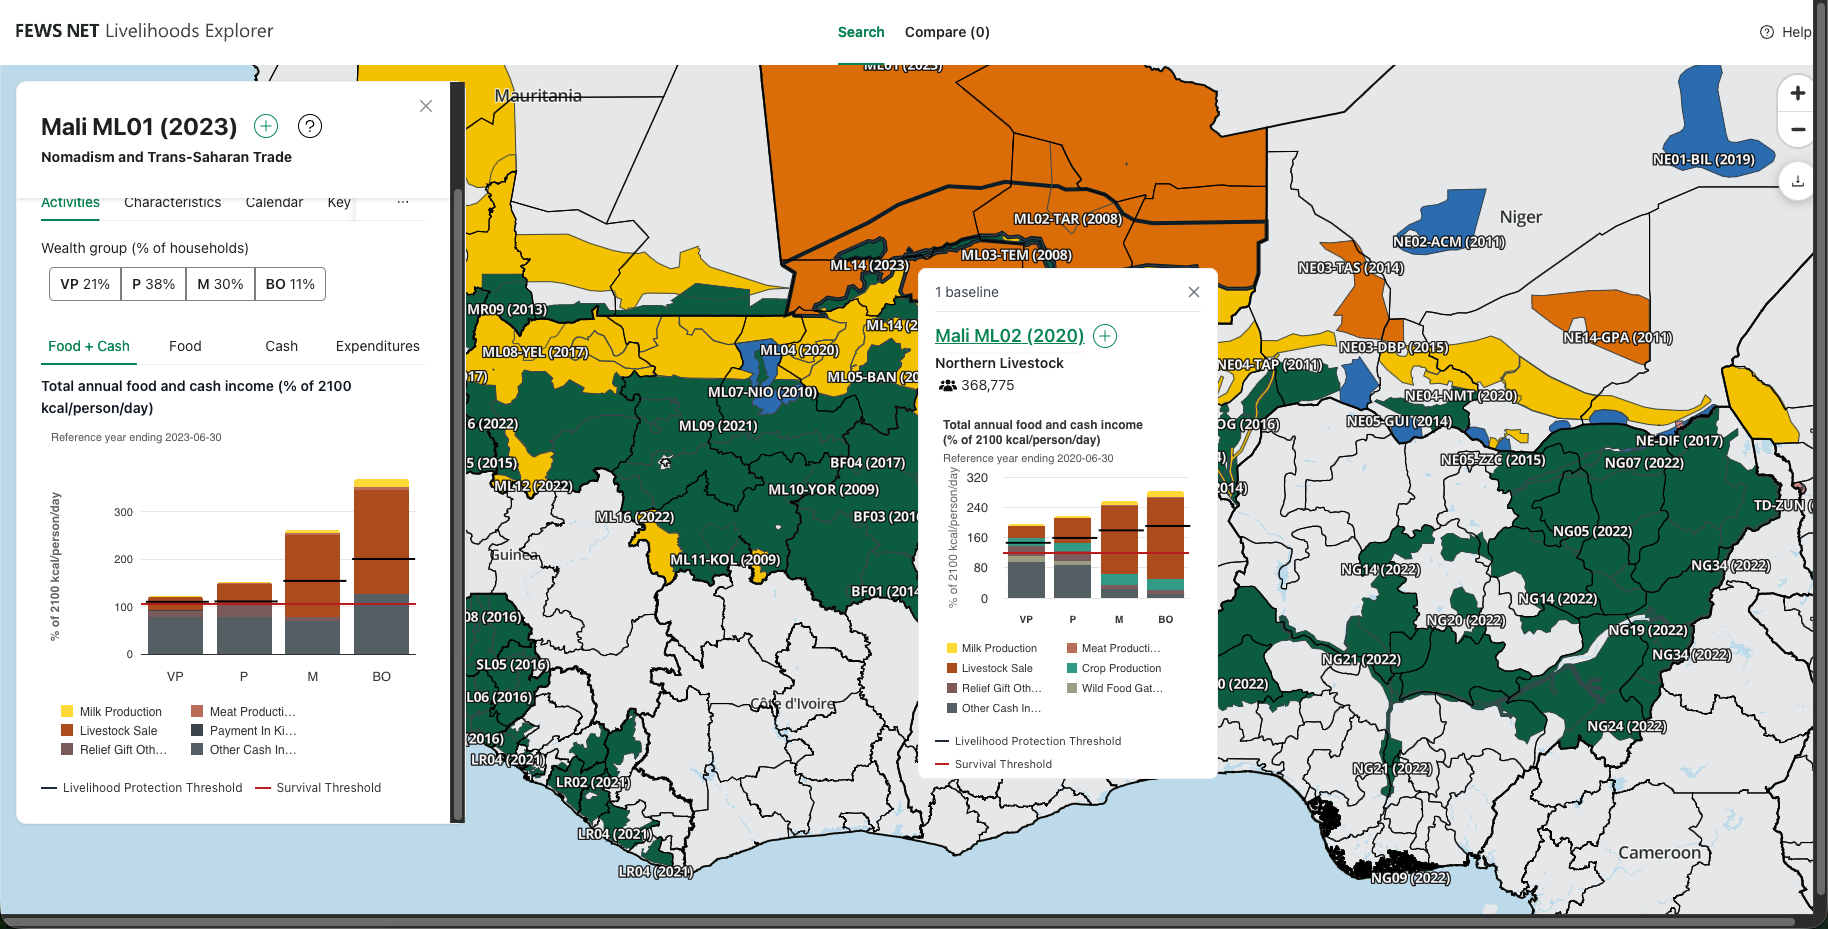
View a detailed summary of data for a Baseline
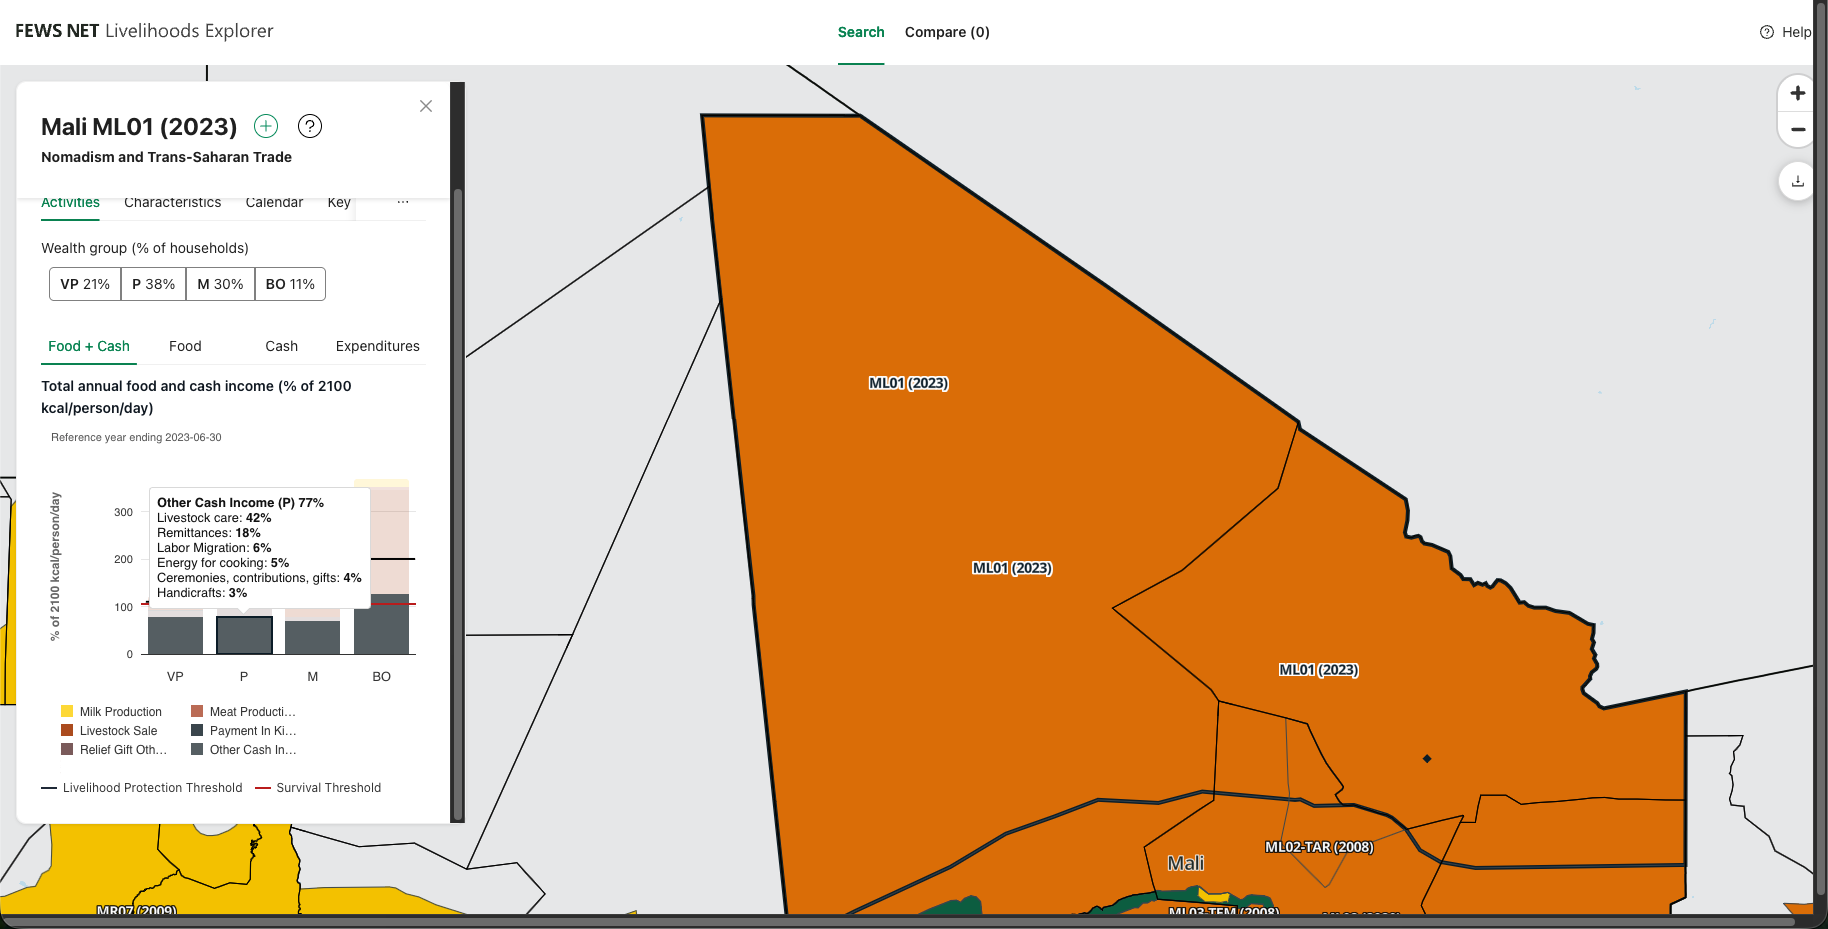
Clicking on the name of a Baseline allows for the visualization of detailed summary information for a specific Livelihood Zone. This helps you quickly understand a great amount of detail about a specific Livelihood Zone of interest.
Quickly compare two Livelihood Zones
Using the Quick view card in conjunction with the Detail view allows users to quickly compare total (food + cash) income data across two different Livelihood Zones. This level of rapid comparison has never been possible before.